
Figure 3. Experiment 2 control-learning results.
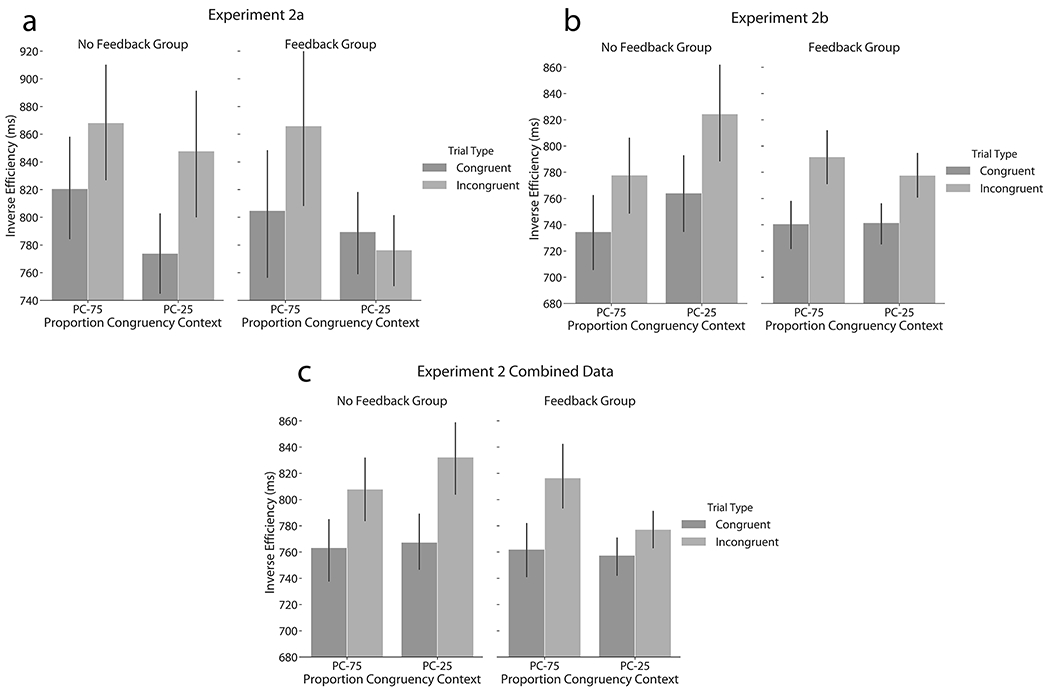
Mean Inverse Efficiency data (± SEM) are displayed as a function of proportion congruent context, current trial congruency, and feedback group for (a & b) the LWPC effect of Experiments 2a and b, which are averaged together in (c).