. 2020 Mar 27;9:e53060. doi: 10.7554/eLife.53060

Figure 1. Schematic of the network control approach and the estimation of control energy.

(a) From a baseline state, we calculated the control energy required to reach a fronto-parietal activation target state. This transition was calculated for each subject based on their structural brain network, which was estimated using diffusion imaging and probabilistic tractography. (b) The average energetic costs to reach the fronto-parietal activation target state varied by cognitive system, with the largest energetic costs being present in the fronto-parietal control network and the ventral attention network. (c) The regional control energy required to reach the fronto-parietal activation target. (d) The control energy cost of a transition to the fronto-parietal activation target state was significantly lower in real brain networks than in null model networks where the strength and degree distribution were preserved.

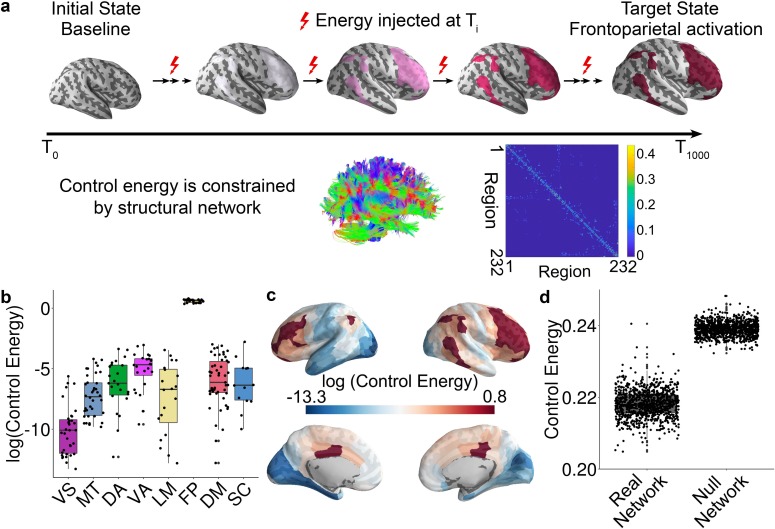
Figure 1.

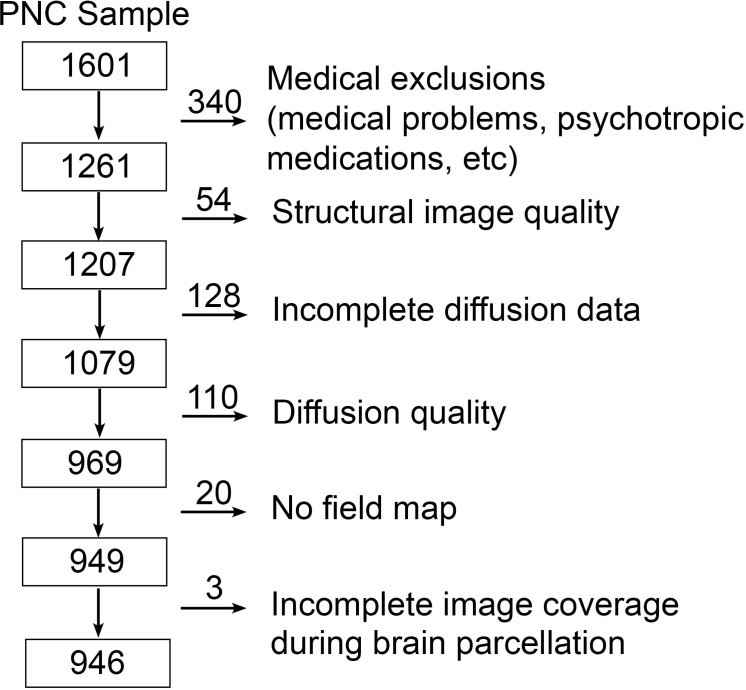
Figure 1—figure supplement 1. Sample construction.

Figure 1—figure supplement 1.

The cross-sectional sample of the Philadelphia Neurodevelopmental Cohort (PNC) has 1601 participants in total. 340 subjects were excluded owing to clinical factors, such as medical disorders. Then, 312 subjects were excluded because of low quality of T1 or diffusion data, incomplete diffusion data, lacking of field map. Finally, three subjects were excluded due to incomplete image coverage during brain parcellation. The final sample consisted of the remaining 946 subjects.
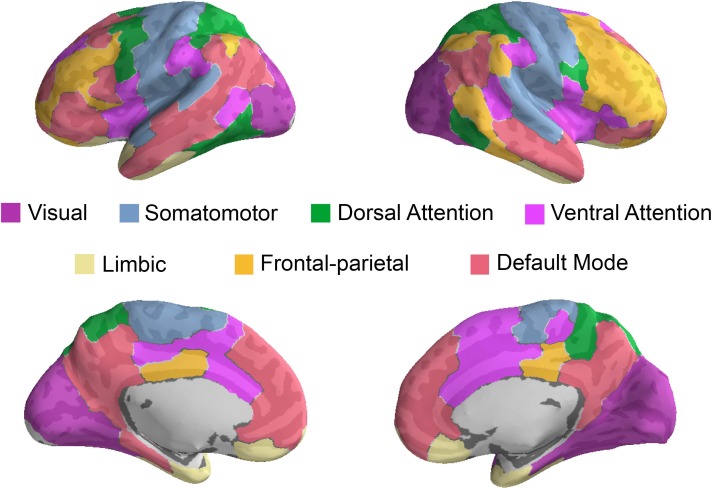
Figure 1—figure supplement 2. Functional brain networks defined by Yeo et al. (2011).

Figure 1—figure supplement 2.

Each parcel was mapped to one of these networks.
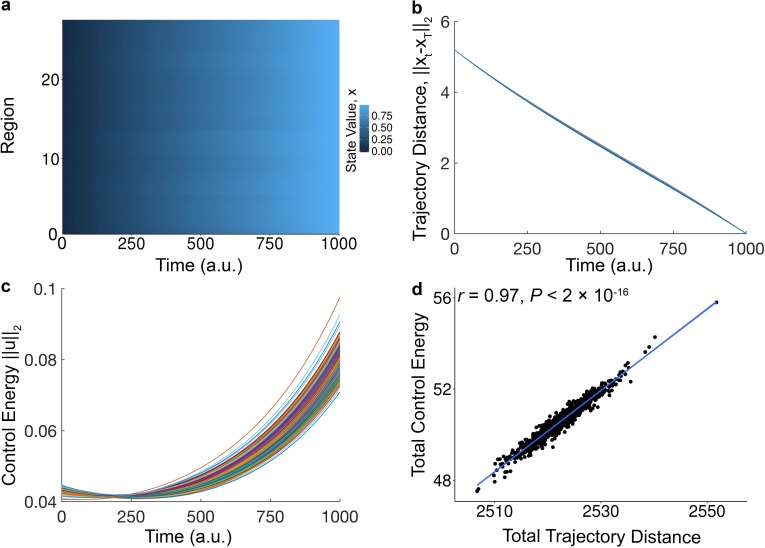
Figure 1—figure supplement 3. Relationship between trajectory distance and control energy.

Figure 1—figure supplement 3.

(a) The activation profiles of all 27 brain regions of the fronto-parietal system during an optimal trajectory from the baseline state to the final state. We define the final state to be a vector in which elements corresponding to the 27 regions of the fronto-parietal system are set to 1, and all other elements are set to 0. The activity magnitudes vary by region and by time. The trajectory here is the average of trajectory over all subjects. (b) For each subject, the Euclidean distance from the current state x(t) to the target state x(T) decreases with time. The final distance to the target state was 0, indicating that all subjects reached the target state. Each line represents a different subject. (c) For each subject, the total control energy cost of all brain regions at a particular time point increases with time. Each line represents a different subject. (d) We observe a tight correlation between the total trajectory distance and the total control energy across subjects (r = 0.97, p<2 × 10−16).