. 2020 Mar 27;9:e53060. doi: 10.7554/eLife.53060

Figure 2. Control energy evolves with age in youth.

(a) The mean whole-brain control energy required to reach the fronto-parietal activation target declines with age. (b) Control energy declines significantly with age in the fronto-parietal, visual, motor and subcortical systems. In contrast, control energy increased in the ventral attention, default mode and limbic systems. For each system with a significant association, the effect size is reported (in each bar) as the partial correlation between system-level control energy and age while controlling for the covariates. There is one outlier in the scatter plot of ventral attention system (Figure 2—figure supplement 1c) and the age-related changes of control energy was not significant (p=0.11) in this system after removing the outlier. (c) The control energy of the fronto-parietal system declines significantly with age. (d) The age effect of control energy for each brain region. The color of the contour of each brain region represents the cognitive system for each region (see Figure 1—figure supplement 2). In the scatterplots shown in panels (a and c), data points represent each subject (n = 946), the bold line indicates the best fit from a general additive model, and the shaded envelope denotes the 95% confidence interval. It should be noted that Z value was derived from the general additive model, which captures both linear and nonlinear relationships; the partial correlation reflects only linear relationships. VS: visual; MT: motor; DA: dorsal attention; VA: ventral attention; LM: limbic; FP: fronto-parietal; DM: default mode; SC: subcortical.

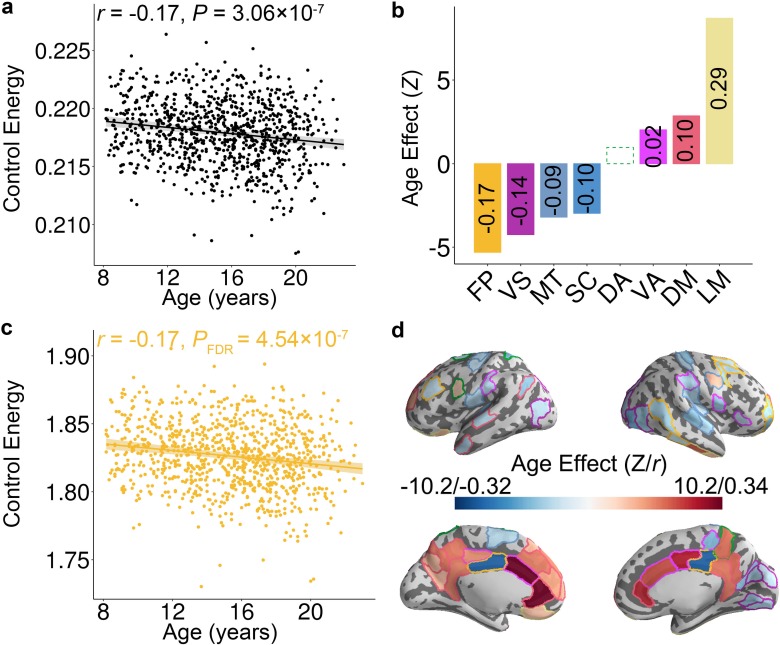
Figure 2.

Figure 2—figure supplement 1. Scatter plots of significant age effects of control energy at the system scale.

Figure 2—figure supplement 1.

The control energy of (a) visual, (b) motor, and (f) subcortical systems decline significantly with age, while that of (c) ventral attention, (d) limbic and (e) default mode systems increase significantly with age. There is one outlier in the scatter plot of ventral attention system and the age-related changes of control energy was not significant (p=0.11) in this system after removing the outlier. Data points represent each subject (n = 946), the bold line indicates the best fit from a general additive model, and the shaded envelope denotes the 95% confidence interval. There is one outlier in the scatter plot of ventral attention system (panel c) and the age-related changes of control energy was not significant (p=0.11) in this system after removing the outlier.
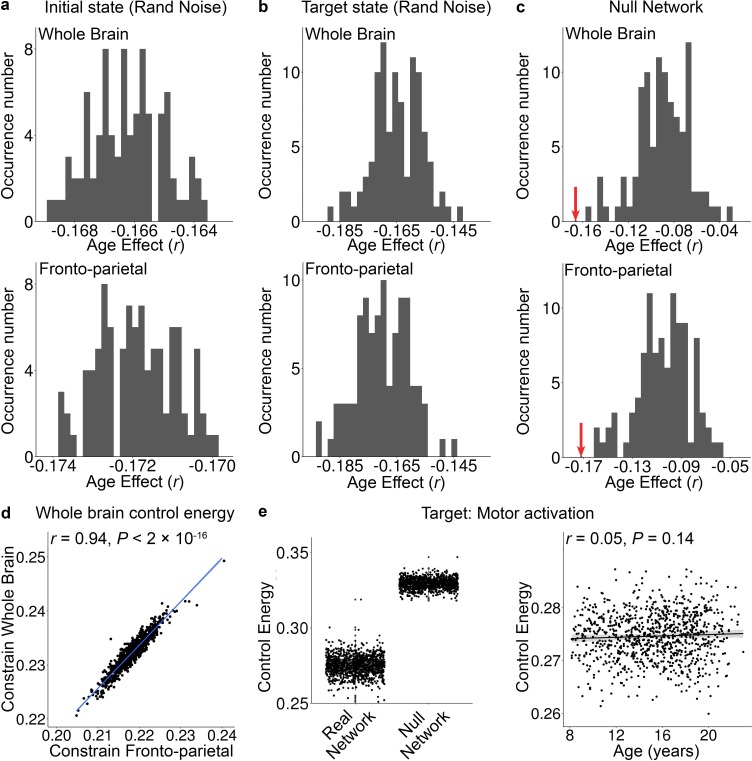
Figure 2—figure supplement 2. Specificity and sensitivity analyses provide convergent results.

Figure 2—figure supplement 2.

The effect size (i.e., partial correlation r) of the age effect of control energy at the whole-brain level and in the fronto-parietal system (a) with 100 different initial states, in which the activation value of regions in fronto-parietal follow the Gaussian distribution with a mean value of 0 and standard deviation of 0.1, and (b) with 100 different target states, in which the activation value of regions in fronto-parietal system follow the Gaussian distribution with a mean value of 1 and standard deviation of 0.1. (c) The distribution of the age effect of average control energy of whole-brain and fronto-parietal systems when using null model networks, which preserve the degree and strength distribution. The null networks were created by brain connectivity toolbox (Rubinov and Sporns, 2010). The red arrow indicates the actual age effect estimated using the data from the real brain network. (d), The whole-brain control energy cost to activate the fronto-parietal system when constraining the whole brain was highly significantly correlated with the energy cost when only the fronto-parietal system was constrained (r = 0.94, p<2 × 10−16). (e), Left: the energy required to reach a motor activation state was significantly higher for null networks than real networks. Right: the whole brain average control energy did not change over the age range studied.
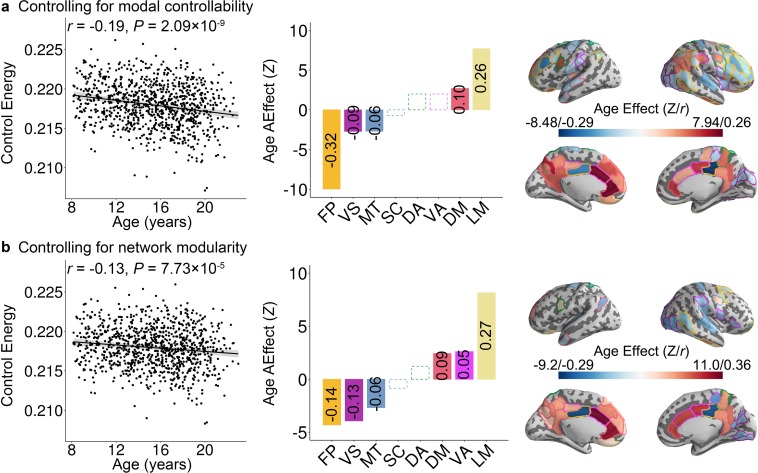
Figure 2—figure supplement 3. Age effects at the whole brain, cognitive system, and nodal levels remain after controlling for the (a) modal controllability and (b) network modularity.

Figure 2—figure supplement 3.

For each system with a significant association, the effect size is reported (in each bar) as the partial correlation between system-level control energy and age while controlling for the covariates. It should be noted that Z values reflect both linear and nonlinear relationships with age, while effect size is reported using a partial correlation, which reflects only linear relationships. VS: visual; MT: motor; DA: dorsal attention; VA: ventral attention; LM: limbic; FP: fronto-parietal; DM: default mode; SC: subcortical.
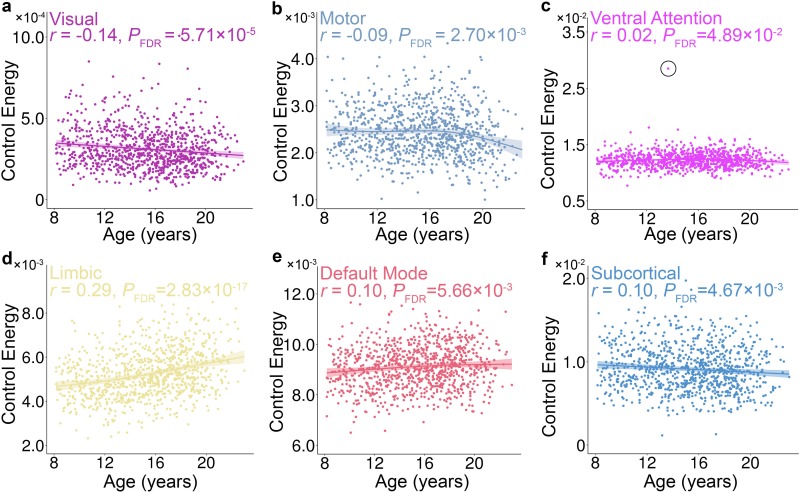
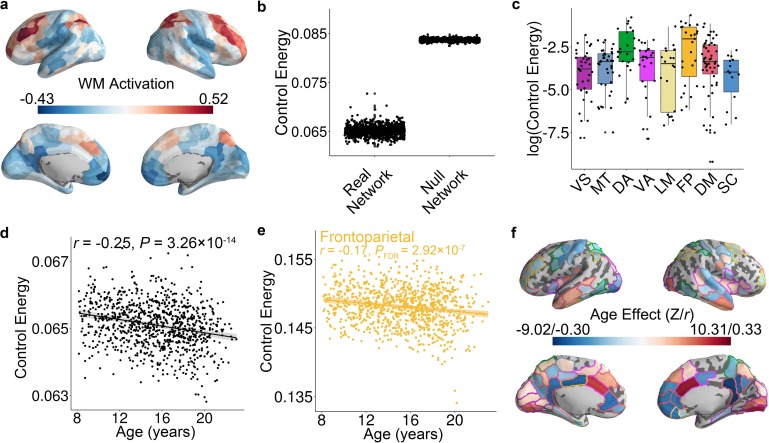
Figure 2—figure supplement 4. Convergent results from a target state defined by a working memory task that recruits the fronto-parietal system.

Figure 2—figure supplement 4.

(a) Alternative target state, defined by the 2-back >0-back contrast on the fractal n-back working memory task (see Satterthwaite et al., 2013). (b) As in the main results, the control energy cost to reach this alternative target state was significantly lower using data from real networks than null networks. (c) Using this alternative target state, the control energy cost was highest in the fronto-parietal system. (d) As in the main results, the mean whole-brain control energy declines with age. (e) Similarly, the control energy of the fronto-parietal system declines significantly with age. (f) Nodal analyses of associations between age and control energy provide convergent results.