. 2020 Mar 27;9:e53060. doi: 10.7554/eLife.53060

Figure 3. The whole-brain control energy pattern contains sufficient information to predict brain maturity in unseen individuals.

(a) The predicted brain maturity index was significantly related to the chronological age in a multivariate ridge regression model that used 2-fold cross validation (2F-CV) with nested parameter tuning. The complete sample of of subjects was divided into two subsets according to age rank. The blue color represents the best-fit line between the actual score of the first subset of subjects and their scores predicted by the model trained using the second subset of subjects. The green color represents the best-fit line between the actual score of the second subset of subjects and their scores predicted by the model trained using the first subset of subjects. (b) Regions with the highest contribution to the multivariate model aligned with mass-univariate analyses and included frontal, parietal, and temporal regions. We displayed the 79 regions with the highest contribution, to facilitate comparisons with mass-univariate analyses (where there were 79 regions with significant age effects).

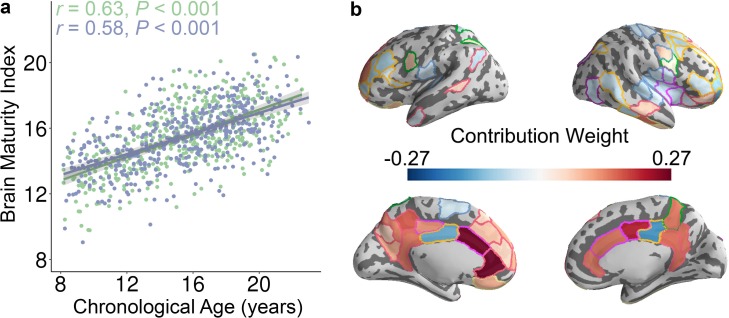
Figure 3.

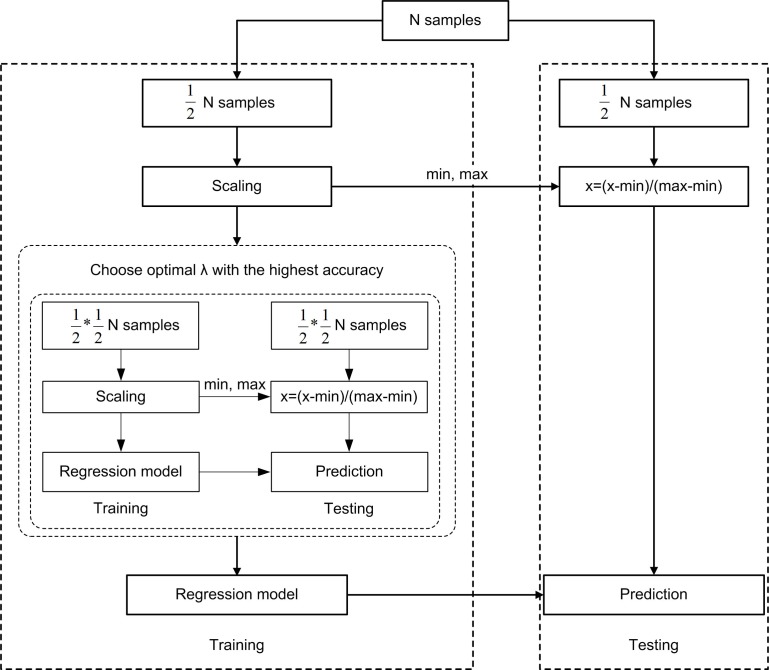
Figure 3—figure supplement 1. Schematic overview of one outer loop of the nested 2-fold cross-validation (2F-CV) prediction framework.

Figure 3—figure supplement 1.

All subjects were divided into 2 halves according to age rank, with the first half used as a training set and the second half used as a testing set. Each feature was linearly scaled between zero and one across the training dataset, and the scaling parameters were also applied to scale the testing dataset. An inner 2F-CV was applied within training set to select the optimal λ parameter. Based on the optimal λ, we trained a model using all subjects in the training set, and then used that model to predict the age of all subjects in the testing set.
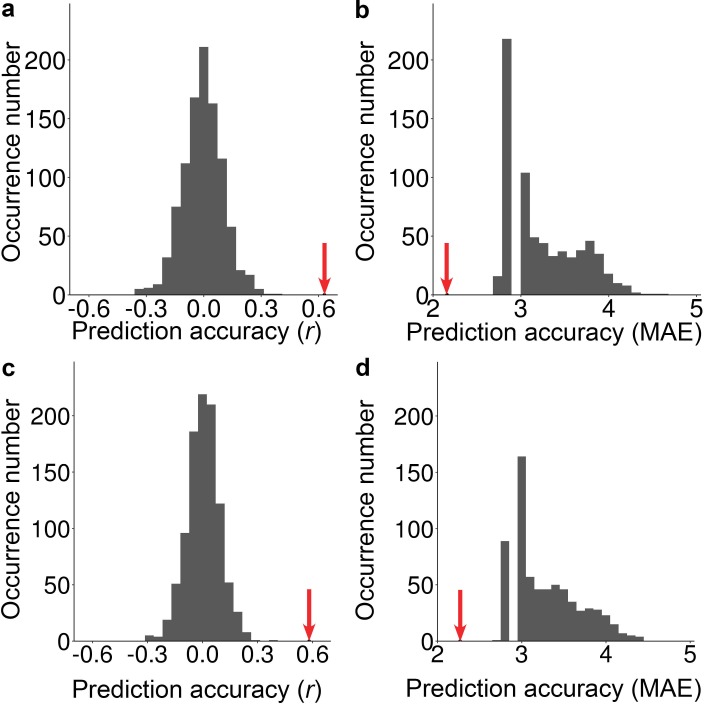
Figure 3—figure supplement 2. The histograms of the permutation distribution of the (a) correlation r and (b) MAE with the first subset used as a training set and the second subset used as a testing set, and (c) correlation r and (d) MAE with the first subset used as the testing set and the second subset used as training set.

Figure 3—figure supplement 2.

The red arrow represents the actual prediction accuracy (i.e., r or MAE). The actual correlation r was significantly higher than expected by chance (p<0.001) and the actual MAE was significantly lower than expected by chance (p<0.001).