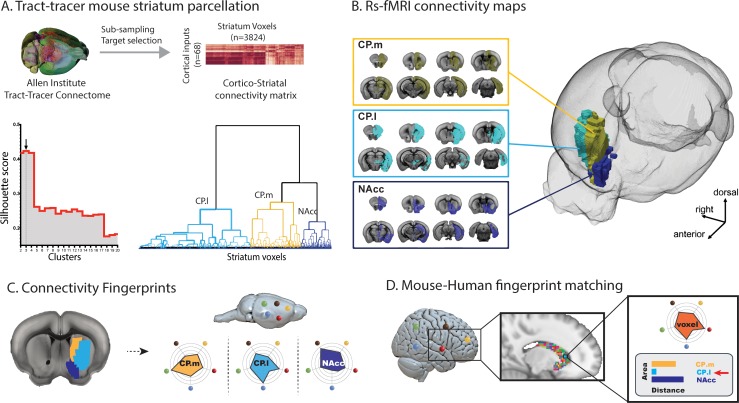
Figure 1. Images illustrating the creation of mouse striatal seeds, their connectivity, and connectivity fingerprint matching.
(A) Schematic illustrating how mouse striatal seeds were created using tracer connectivity data from the Allen Institute. A connectivity matrix was extracted describing the volume of terminal label in each striatal voxel from 68 cortical injection sites. Correlating the values in this matrix established the similarity of connectivity fingerprints across striatal voxels. Hierarchical clustering was used to sort the correlation matrix into voxels with similar connectivity patterns (lower right dendrogram) and silhouette value was used to establish the number of clusters where within-cluster similarity and between-cluster differences were greatest (lower left plot). The arrow shows that the best solution according to silhouette value was a three cluster solution. (B) RsfMRI voxelwise connectivity maps for the three striatal seeds. (C) A schematic illustrating the process of extracted connectivity fingerprints for the three mouse striatal seeds. Connectivity fingerprints show the strength of connectivity (correlation of rsfMRI timeseries) between each striatal seed region and target regions outside the striatum D) In humans (or macaques), connectivity fingerprints were extracted from each voxel of the striatum - comparing the connectivity strength of striatal voxels with human homologs of the five target regions identified in mice. The similarity of each human voxel fingerprint can then be compared against each of the three mouse striatal fingerprints.


