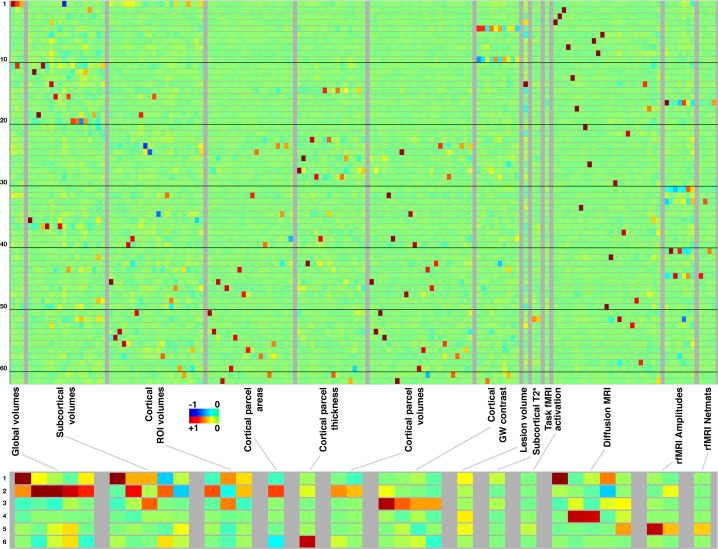
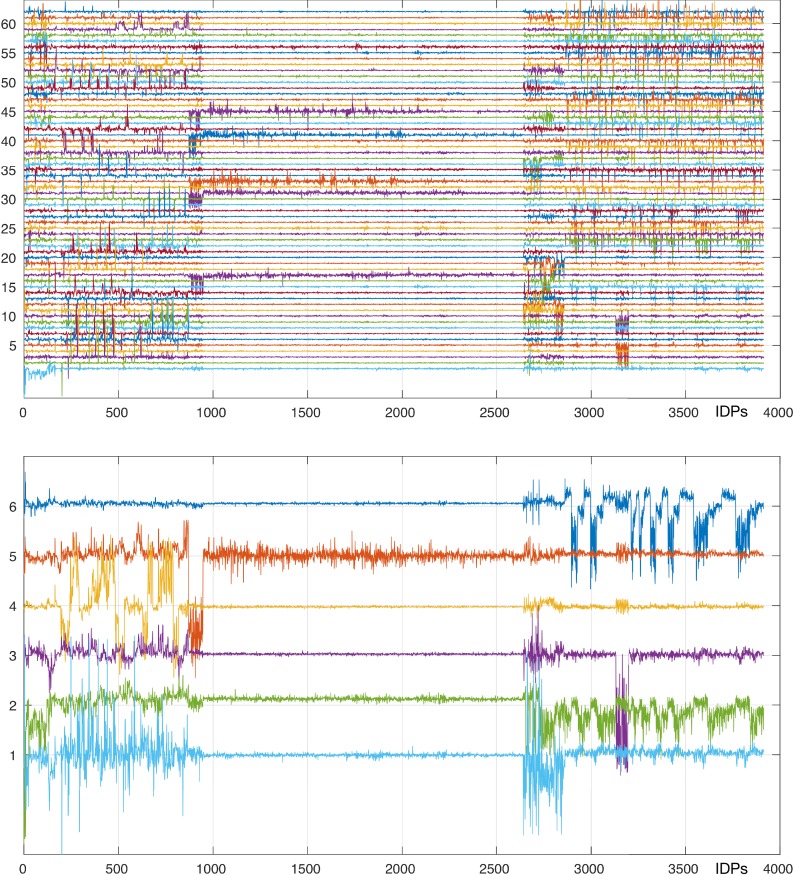
Figure 2. Mapping of 62 brain-aging modes and 6 mode-clusters onto different classes of strucural and functional imaging-derived phenotypes (IDPs).
Above: Each row shows the mapping of one brain-aging mode onto the imaging data, with black lines delineating groups of 10 modes for ease of reference. The full plots spanning all 3913 IDPs are shown in Figure 2—figure supplement 1; here, each class of IDPs is reduced using PCA and then ICA to the most representative pseudo-IDPs (see Materials and methods), meaning that each column in the plot relates to a fixed and distinct combination of original IDPs. IDP classes have fewer/greater distinct values here dependent on the number of IDPs in a class, and how highly they correlate with each other. Colour-coded values shown are unitless and mapped into the range −1:1. Below: The equivalent (separately computed) summary figure mapping the 6 mode-clusters onto IDPs.


