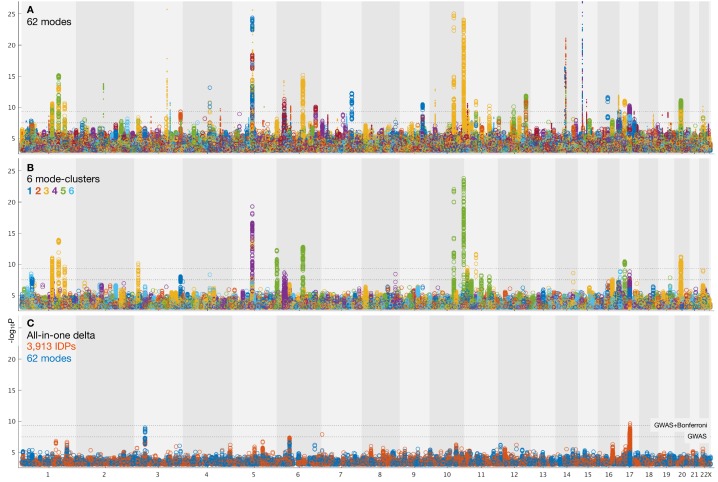
Figure 3. Summary plots for GWAS of brain aging.
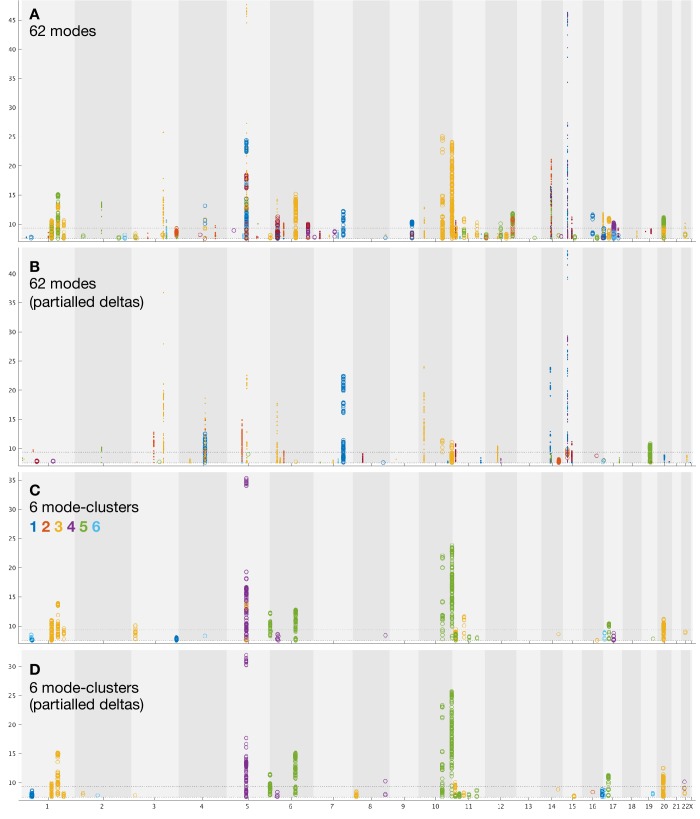
(A) Separate GWAS for each of the 62 modes of brain aging. The y axis is (significance of the genetic association) and the x axis is SNPs, arranged according to chromosomes 1:22 and X. For convenience of display some points of even higher significance (with redundant content compared with the points seen here) are truncated; for complete plots see Figure 3—figure supplement 1, and for individual plots (one per mode), see Data availability. The lower dotted line shows the standard GWAS threshold correcting for multiple comparisons ( =7.5), and the upper line shows the result of an additional Bonferroni correction for the main 62+6 separate GWAS ( =9.33). Circles denote the first 31 brain-aging modes (i.e., those with the strongest aging effect) and dots the next 31 (with weaker aging). (B) Separate GWAS for each of the 6 mode-clusters of brain aging. Again, see Figure 3—figure supplement 1 and Data availability for complete and individual plots. (C) GWAS plots for two all-in-one estimates of brain-aging delta (with no points removed). In orange is shown the GWAS for the single delta estimated using all 3913 IDPs according to the approach in Smith et al. (2019). In blue is shown the GWAS for the single delta estimated using the 62 modes. In both cases, the richness of genetic associations is clearly greatly reduced, compared with identifying distinct associations for each mode in its own right.


