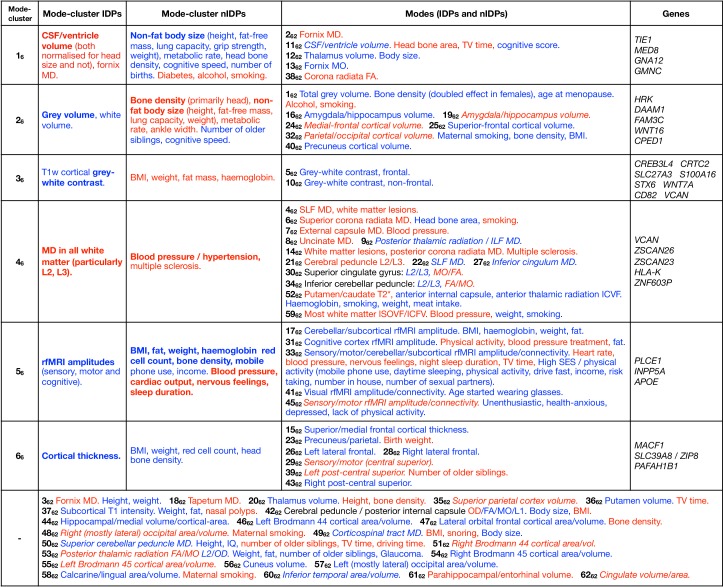
Figure 4. Dominant imaging, non-imaging and genetic associations between brain-age delta from all mode-clusters and modes.
The left side of the table focuses on the main patterns of associations with the 6 mode-clusters, while the right side also lists dominant associations with individual modes, grouped according to the mode-clusters. At the bottom are results from individual modes that do not have one clear associated mode-cluster. Red text signifies positive correlation with brain-age delta (meaning in general a detrimental factor with respect to aging), and blue indicates negative correlation (i.e. a positive causal factor and/or outcome with respect to aging). Where the all-in-one brain-age modelling has negative , the signs of associations between delta and IDPs becomes the inverse of the original ICA IDP weight; in such cases, the table makes this appropriate adjustment to text colour (such that the colour reflects the sign of assocation between delta and IDP, and not ICA weight), but we denote where this occurs by use of italics. Bold text indicates relatively stronger associations (in terms of strength of effects and/or number of related variables). Results included here are generally stronger than for nIDPs (see Materials and methods), and SNPs are listed only where replication succeeded. To help focus the descriptions of non-imaging variables, we largely list their associations with the partialled deltas; this therefore concentrates on unique variance in deltas. When working with partialled variables (or equivalently multiple regression), and when adjusting for some of the imaging confounds (such as head size, when considering volumetric measures), signs of associations can in some cases be non-trivial to interpret.

