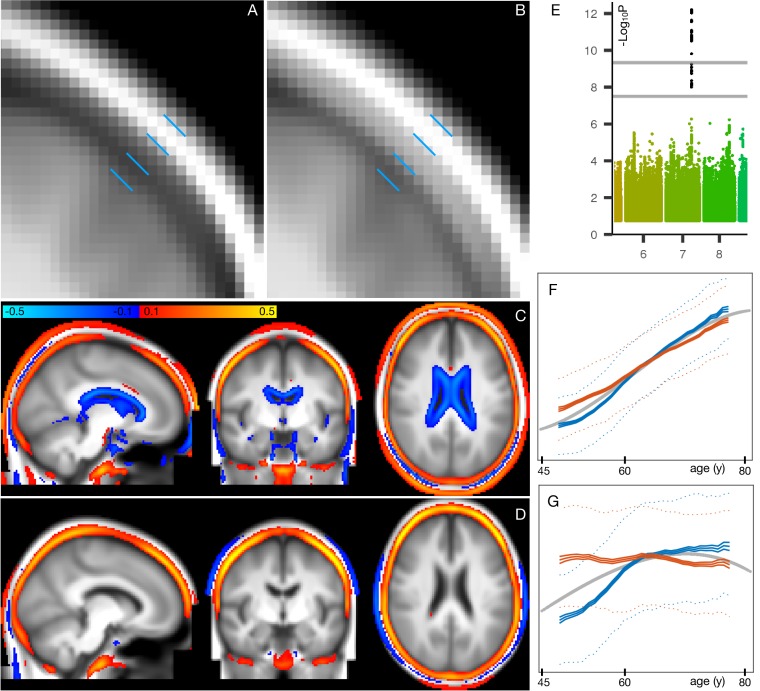
Figure 5. Spatial mapping of mode 162 onto original T1-weighted MRI data, along with genetic and age-dependent plots.
(A) A region-of-interest from the average T1-weighted structural image from the 1000 subjects with the lowest delta values for this mode. The images have been linearly-aligned into standard (MNI152) template space, and have not been brain-extracted, so that non-brain tissues can be seen. The blue lines delimit 3 ‘layers’ seen in cross-section; from the outside in, these are skin/fat outside the skull, the skull, and cerbrospinal fluid outside of the brain. (B) The equivalent average image from the 1000 subjects with the highest delta values. There is no obvious geometric shift (e.g. of tissue boundaries), but the intensity values are clearly higher within the skull; this is reflecting increase in bone marrow fat with brain-age delta. (C) The difference between the two average images (all images were first normalised to have a mean intensity of 1). (D) The same difference of averages, but after regressing all confounds (including age) out of the voxelwise imaging data, and working with the partialled delta values for mode 162; with this more focussed analysis, changes around the ventricle are no longer obvious, but the change in skull intensity remains. (E) The one significant genetic association (on chromosome 7) for this mode. The lower grey line shows the standard single-phenotype threshold of 7.5; the upper line shows this after Bonferroni adjustment for multiple tests (modes). This significant association was also found in the replication dataset. (F) The mean age curves for mode 162 (as described in more detail in Materials and methods and Figure 1—figure supplements 3–9). Females are shown in blue, males in orange; the y axis is the unitless mode subject-weights (averaged across subjects with an averaging sliding window). The greatest rate of age-related change is in females, in the 10y following menopause. (G) This pattern is even more striking in the partialled subject-weight curves (where other modes have first been regressed out of mode 162.).

