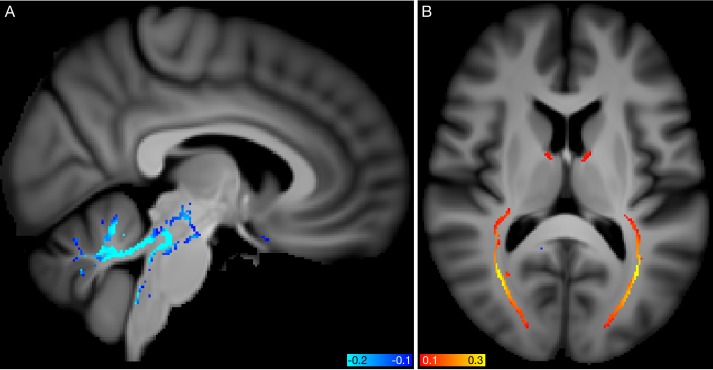
Figure 6. Spatial mapping of modes 5062 and 5362 from the diffusion MRI data.
(A) Voxelwise correlation of the partialled brain-age delta values (one per subject) from mode 5062, into the dMRI MD (mean diffusivity) data. The colour overlay shows correlation values, thresholded at a magnitude of 0.1. (B) Voxelwise correlation of the partialled brain-age delta from mode 5362, into the dMRI FA (fractional anisotropy) data.

