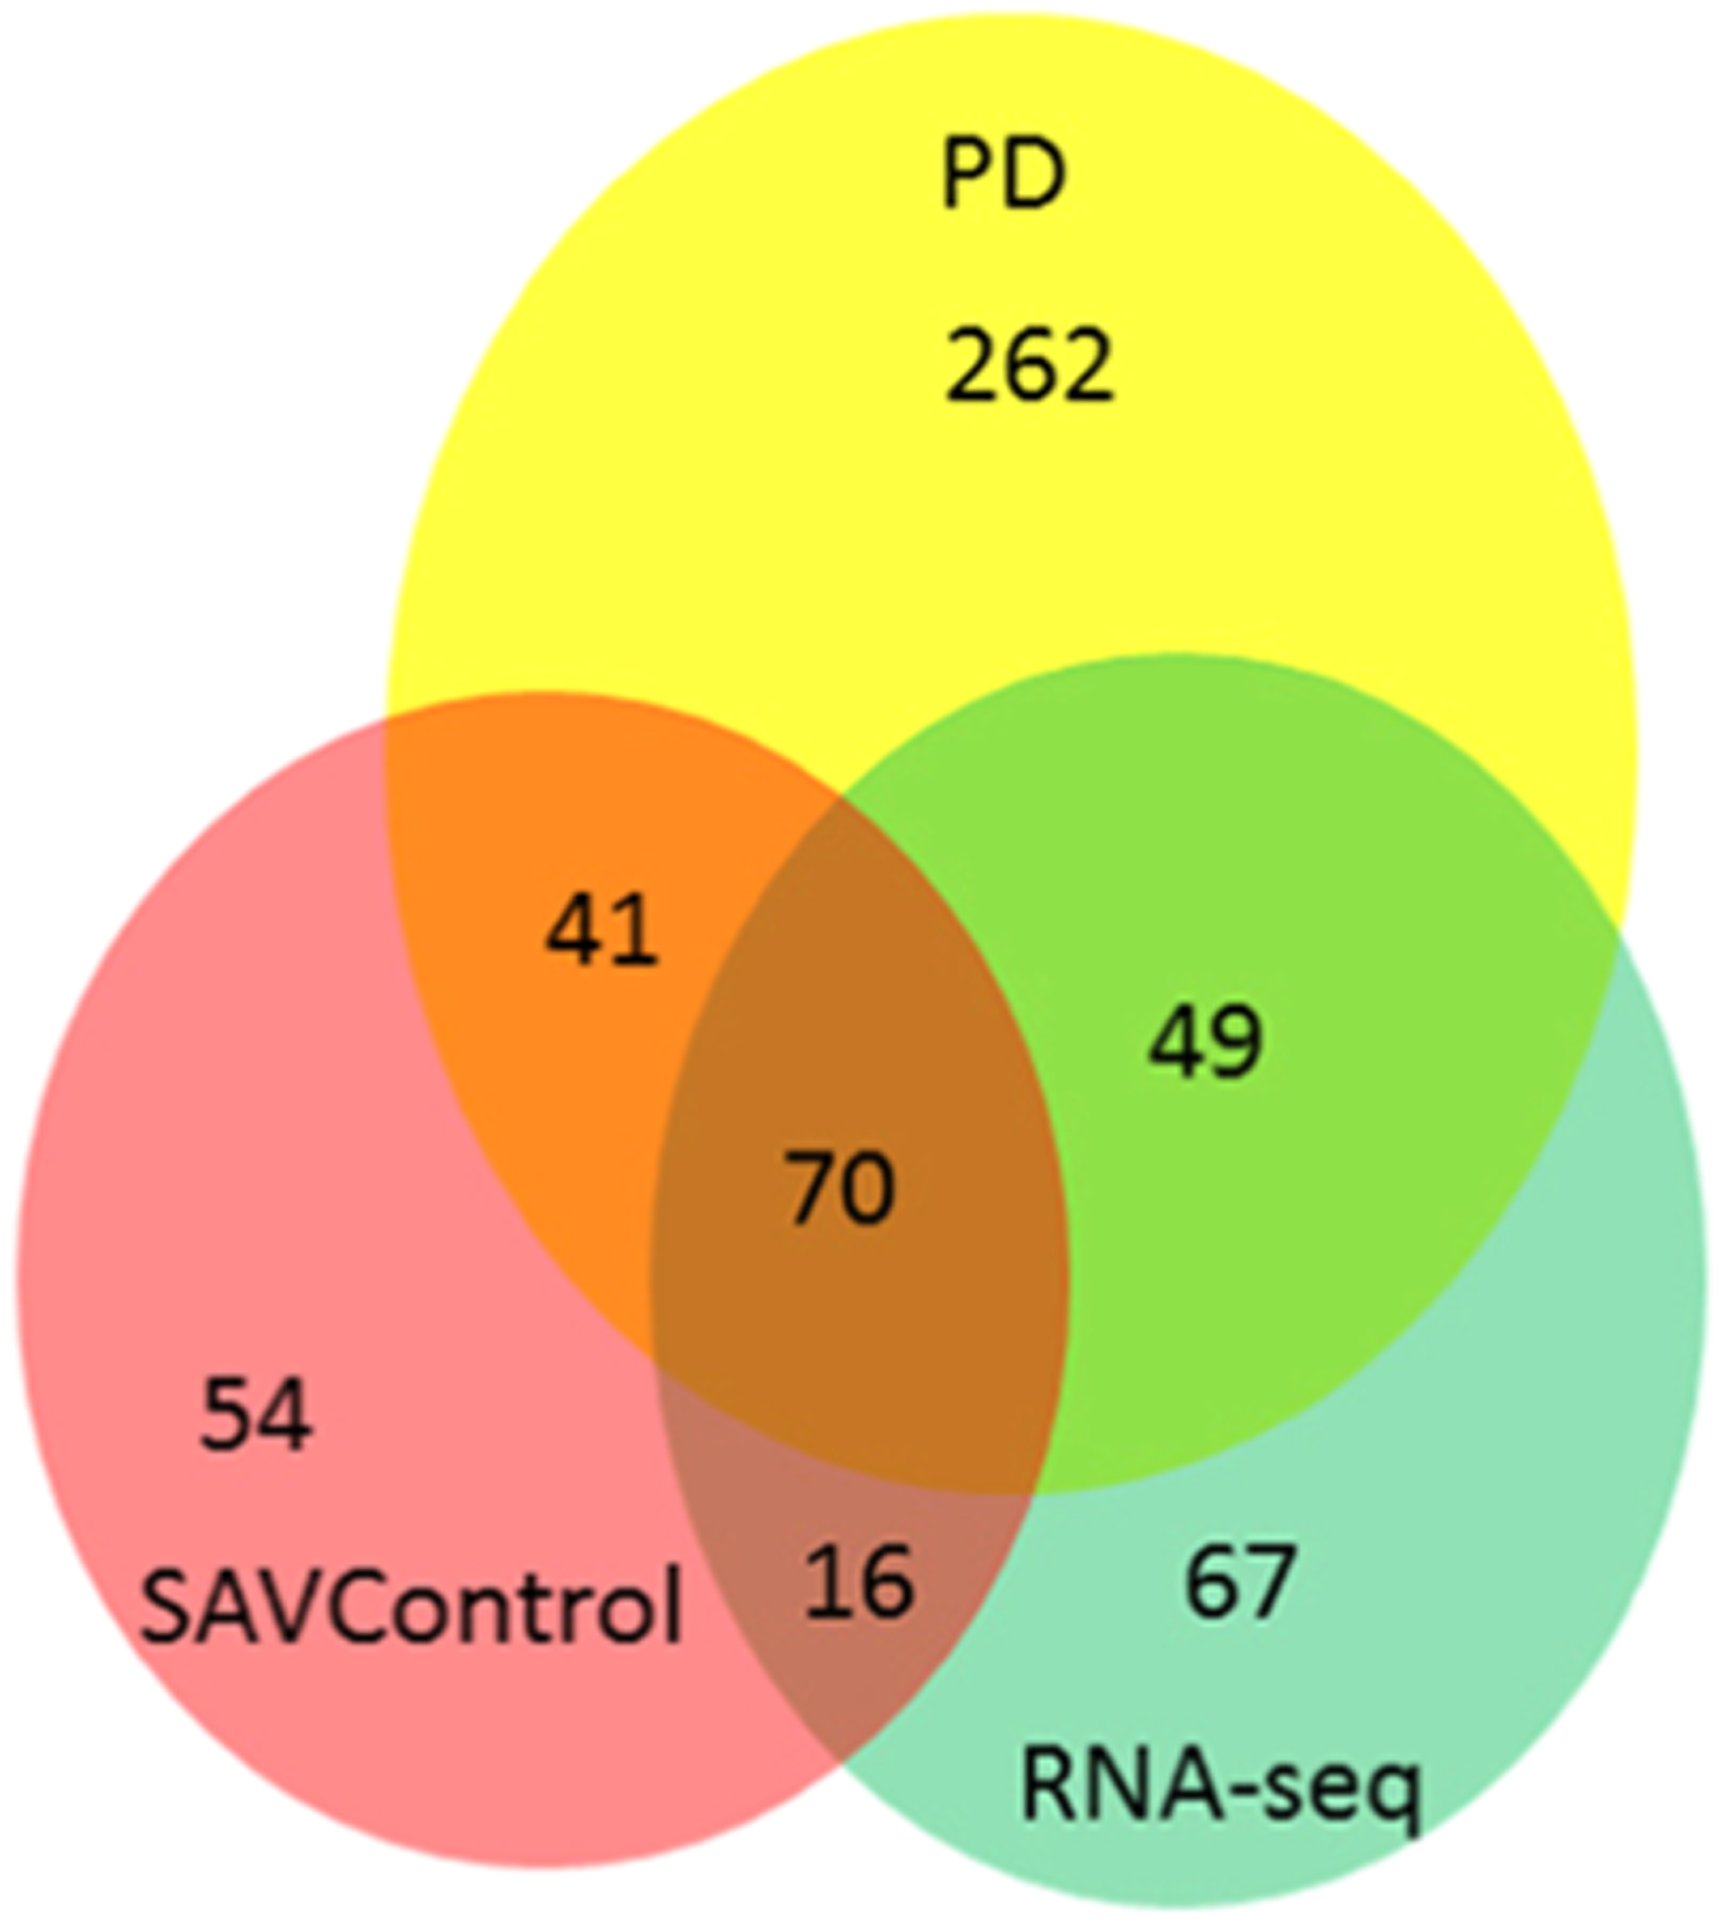
Figure 3.

Venn diagram picture showing the SAAV identification and overlap among the three strategies. The yellow circle represents the Proteome Discoverer database searching. The green circle represents the RNA-seq database searching, and the red circle represents the SAVControl strategy.
