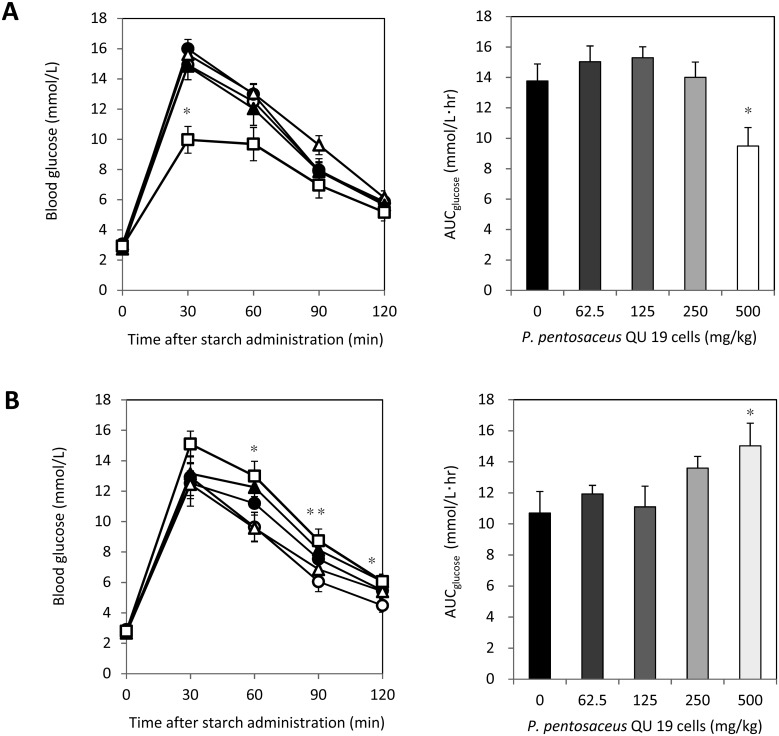
Fig. 4.
Effects of viable P. pentosaceus QU 19 cells (A) and heat-treated cells (B) on the oral starch tolerance test and AUCglucose (mean ± SEM).
Blood samples were taken at 0, 30, 60, 90, and 120 min after the starch and cell loading. Symbols: ○, control; ●, 62.5 mg/kg; Δ, 125 mg/kg; ▲, 250 mg/kg; □, 500 mg/kg. Values with asterisks are significantly different from those of the control (0 mg/kg) group by Dunnett’s test (n=8). *p<0.01; **p<0.05. The area under the curve for glucose (AUCglucose) was determined using the trapezoidal rule.

