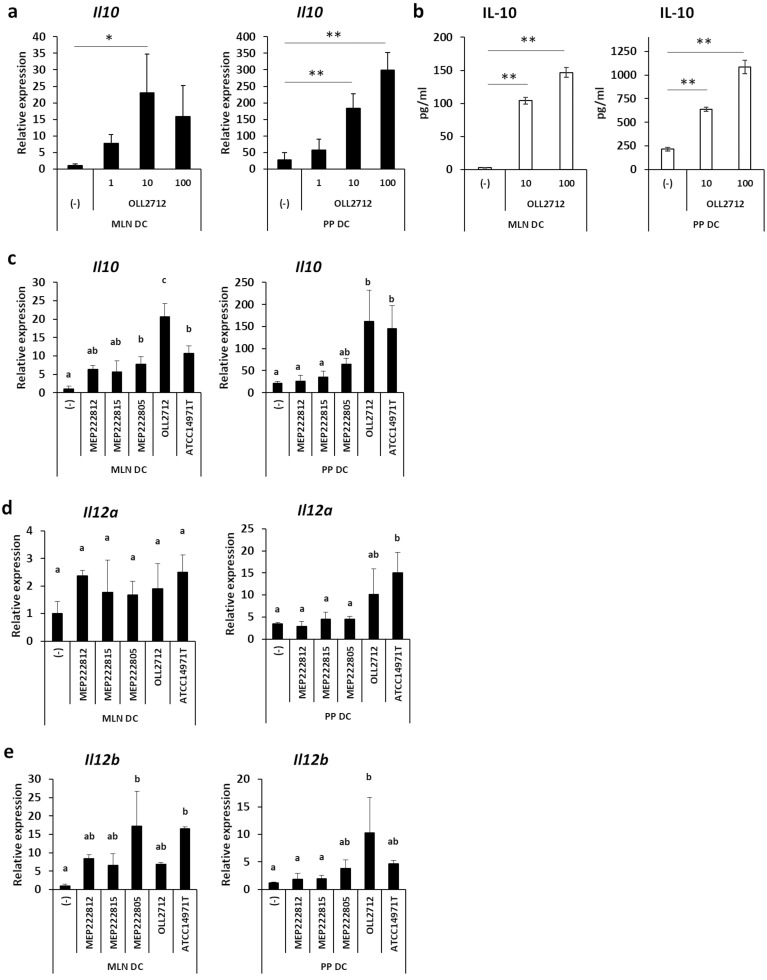
Fig. 1.
Effects of L. plantarum OLL2712 on intestinal dendritic cells (DCs).
(a) Mesenteric lymph node (MLN) or Peyer’s patch (PP) DCs (1 × 10⁵ cells) were incubated with heat-killed L. plantarum OLL2712 (1 µg/mL, 10 µg/mL, 100 µg/mL) for 18 hr. The cells were pooled, and relative IL-10 mRNA expression was measured by qPCR. Data are shown as the mean ± SD of 3 independent experiments. (b) MLN or PP DCs (2 × 10⁵ cells) were incubated with heat-killed L. plantarum OLL2712 (10 µg/mL, 100 µg/mL) for 72 hr. The IL-10 protein in the supernatants was measured by immunoassay. The plot shows representative data from one experiment. Data are shown as the mean ± SD of cultured wells (n=3). (c) MLN or PP DCs (1 × 10⁵ cells) were incubated with heat-killed lactic acid bacteria (LAB) (10 µg/mL) for 18 hr. The cells were collected, and relative IL-10 mRNA expression was measured by qPCR. The plot shows representative data from one experiment. Data are shown as the mean ± SD of cultured wells (n=3). (d, e) MLN or PP DCs (1 × 10⁵ cells) were incubated with heat-killed LAB (10 µg/mL) for 18 hr. The cells were collected, and relative Il12a (IL-12p35) (d) and Il12b (IL-12p40) (e) mRNA expression levels were measured by qPCR. The plot shows representative data from one experiment. Data are shown as the mean ± SD of cultured wells (n=3). (a, c, d, e) Relative expression was calculated as the ratio to expression of non-stimulated MLN DCs. (a, b) Two to three independent experiments were performed. Statistical analysis was performed by Dunnett’s test. *p<0.05; **p<0.01. (c–e) Two independent experiments were performed. Statistical analysis was performed by Tukey’s HSD test. Values not sharing a common letter are significantly different (p<0.05).

