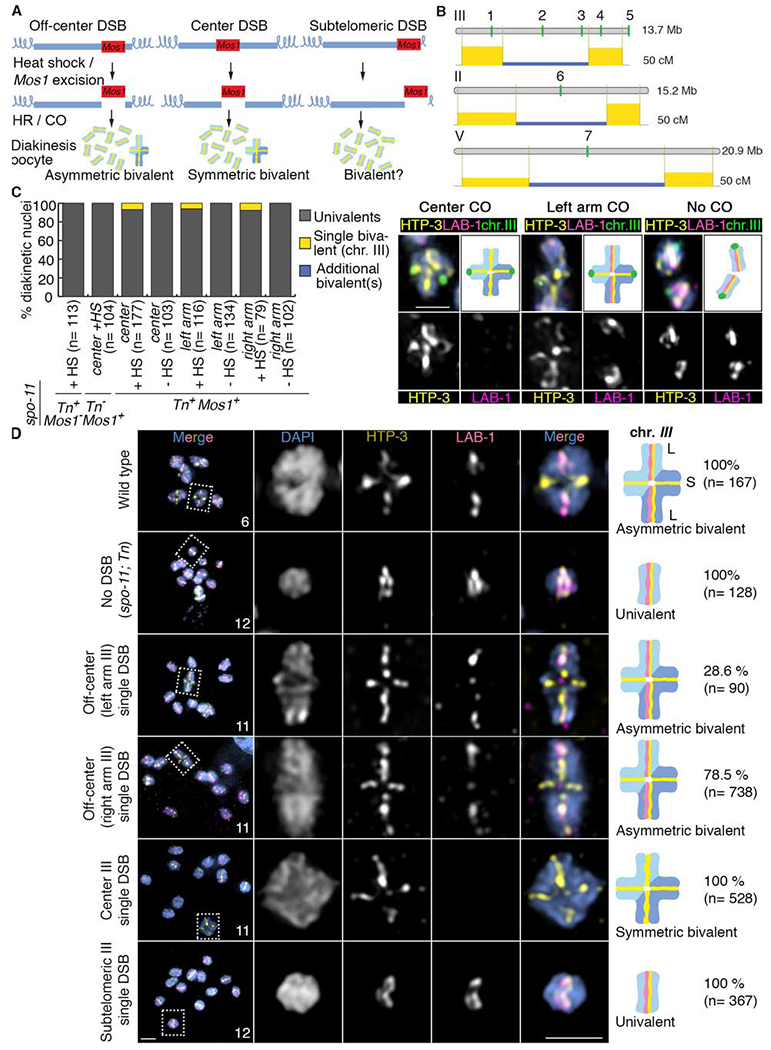
Figure 1. The position of a single DSB/CO affects late prophase I chromosome remodeling.

(A) Schematic drawing of the single inducible DSB assay. Blue lines represent the chromosomes and the red boxes correspond to the Mos1 transposon inserted at different chromosomal locations. After heat shock-induced DSB formation by transposon excision and subsequent repair via homologous recombination (HR), diakinesis nuclei were analyzed for the presence of either a single asymmetric or symmetric bivalent (all other chromosomes were univalents given that this analysis was performed in a spo-11 mutant background that lacks endogenous DSBs). (B) Schematic drawing of the locations of the Mos1 transposon insertions on chromosomes III, II and V. 1 indicates the location of ttTi1730, 2 the location of ttTi23808, 3 the location of ttTi2384, 4 the location of ttTi13055 and 5 the location of ttTi17604 on chromosome III. 6 indicates the location of ttTi5605 on chromosome II and 7 the location of ttTi35006 on chromosome V. Numbers 1 and 4 indicates DSBs occurring in an off-center position, 2, 6 and 7 indicates DSBs occurring in a center position, 5 indicates a DSB occurring in a subtelomeric position and 3 indicates a DSB occurring at the border of the center region. The physical (Mb) and genetic (cM) maps are shown one above of the other for every chromosome. Genetic maps are based on Rockman and Kruglyak [42]. The yellow rectangles represent the recombination frequencies on the chromosome arms compared to frequencies on the center region in blue. (C) Quantification of bivalent formation for chromosome III by immunoFISH analysis of late diakinesis oocytes following Mos1 transposon excision (+ or − heat shock; HS) from the indicated locations on chromosome III. All lines carry the spo-11 mutation and either presence or absence of a Mos1 transposon insertion (Mos1+ or Mos1−, respectively) on chromosome III and presence or absence of the transposase (Tn+ or Tn− respectively). Representative immunoFISH images with LAB-1 (magenta), HTP-3 (yellow) and a FISH probe for chromosome III (green). (D) Quantification of asymmetric or symmetric bivalent formation in late diakinesis oocytes based on coimmunostaining for the HORMA domain-containing protein HTP-3 (yellow) and LAB-1 (magenta). Immunofluorescence images from wild type, spo-11;Tn (transposase+) mutants and spo-11 mutants in which a single Mos1-induced DSB was generated in one of the following locations on chromosome III: off-center (at either the right or left arms), the center, and the subtelomeric region. Both chromosomal axes are highlighted by HTP-3 while LAB-1 is restricted to the long arm of the bivalents in wild type. Total numbers of DAPI-stained bodies (bivalents/univalents) observed in the oocytes at diakinesis are shown in the first column. Dashed boxes indicate the bivalents/univalents shown at higher magnification. Illustrations on the right depict the chromosome configuration observed at this stage and the localization of HTP-3 (yellow) and LAB-1 (magenta). Long (L) and short (S) arms of the asymmetric bivalent are indicated on wild type. n= number of nuclei scored. Bar, 2 μm. See also Figures S1, S2 and Data S1 and S2.
