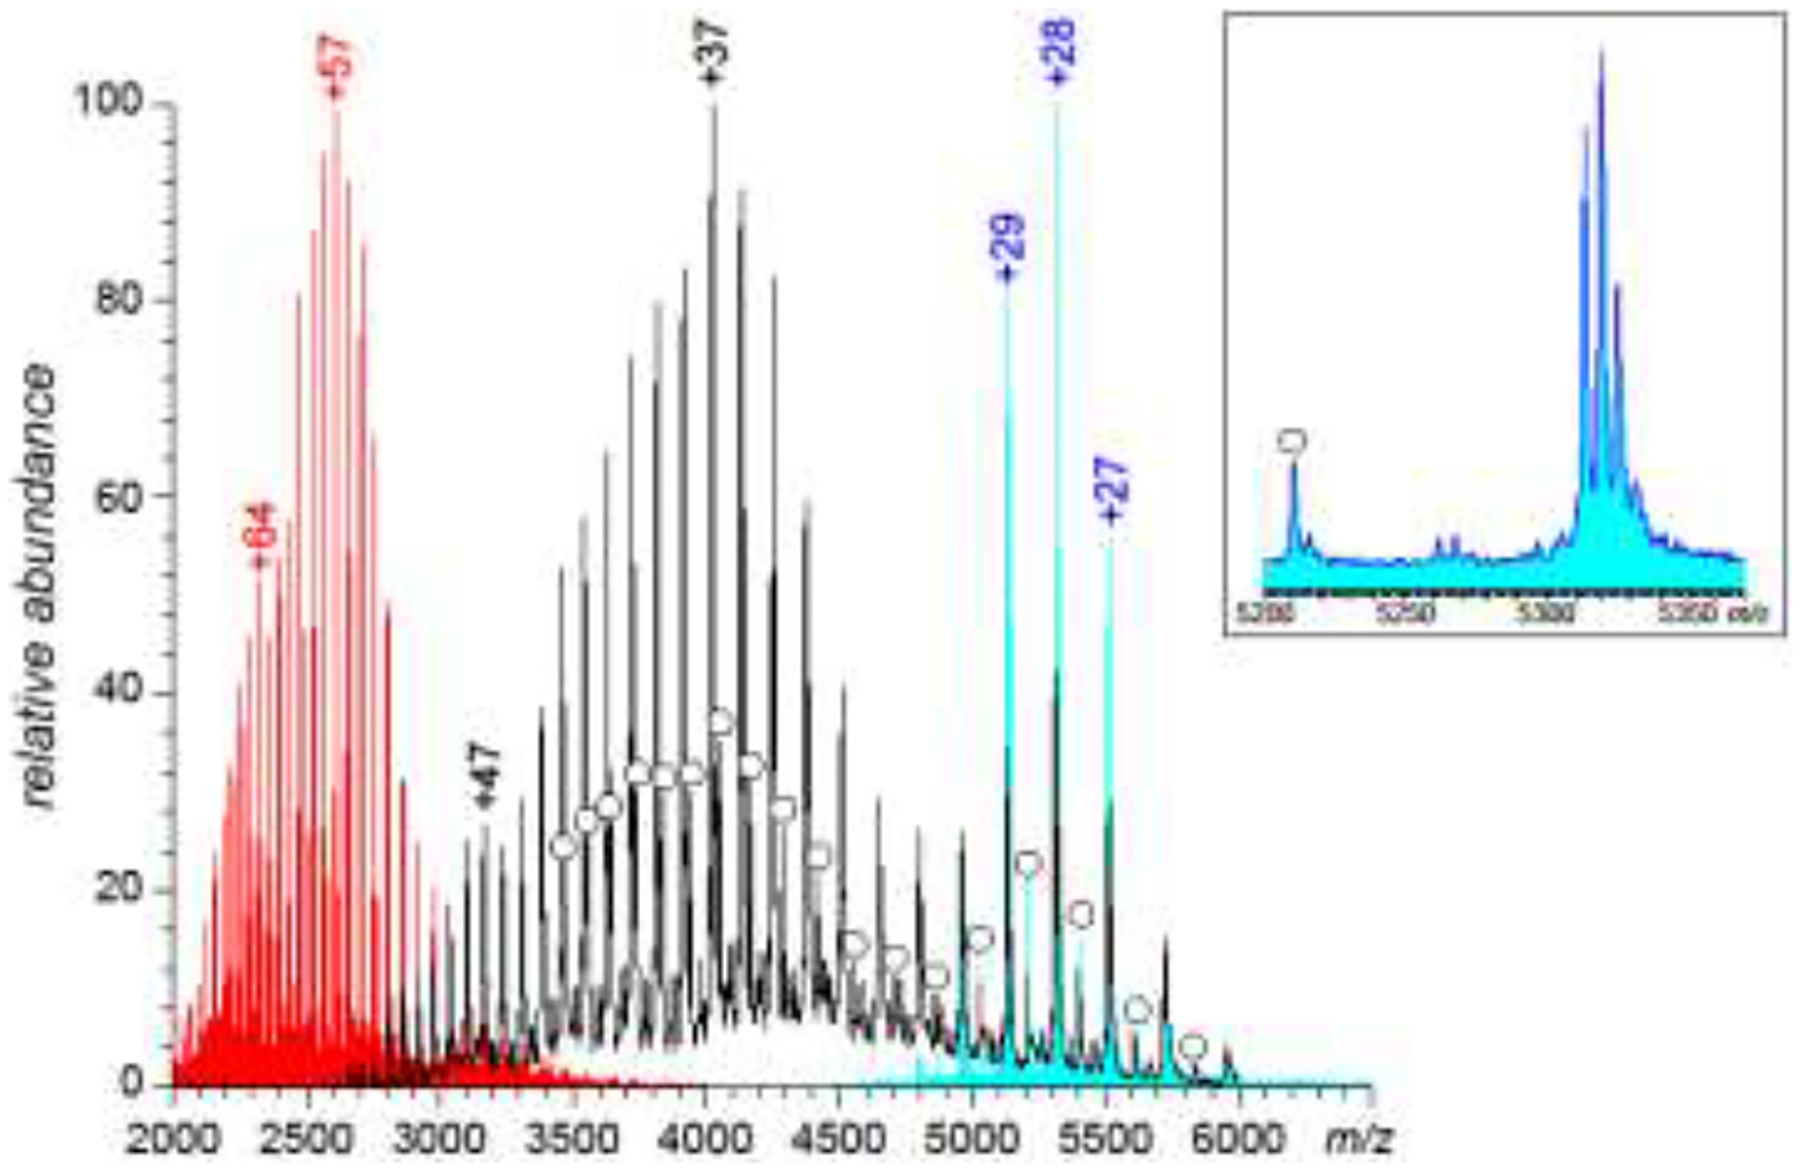
Figure 1.

Mass spectra of a monoclonal antibody acquired under strongly denaturing (red trace), mildly denaturing (black trace) and near-native conditions (cyan trace). The inset (a zoomed view of the latter mass spectrum) shows contributions to the ionic signal form all different glycoforms of the protein, including the carbohydrate-free form (labeled with a circle).
