
Fig. 4.
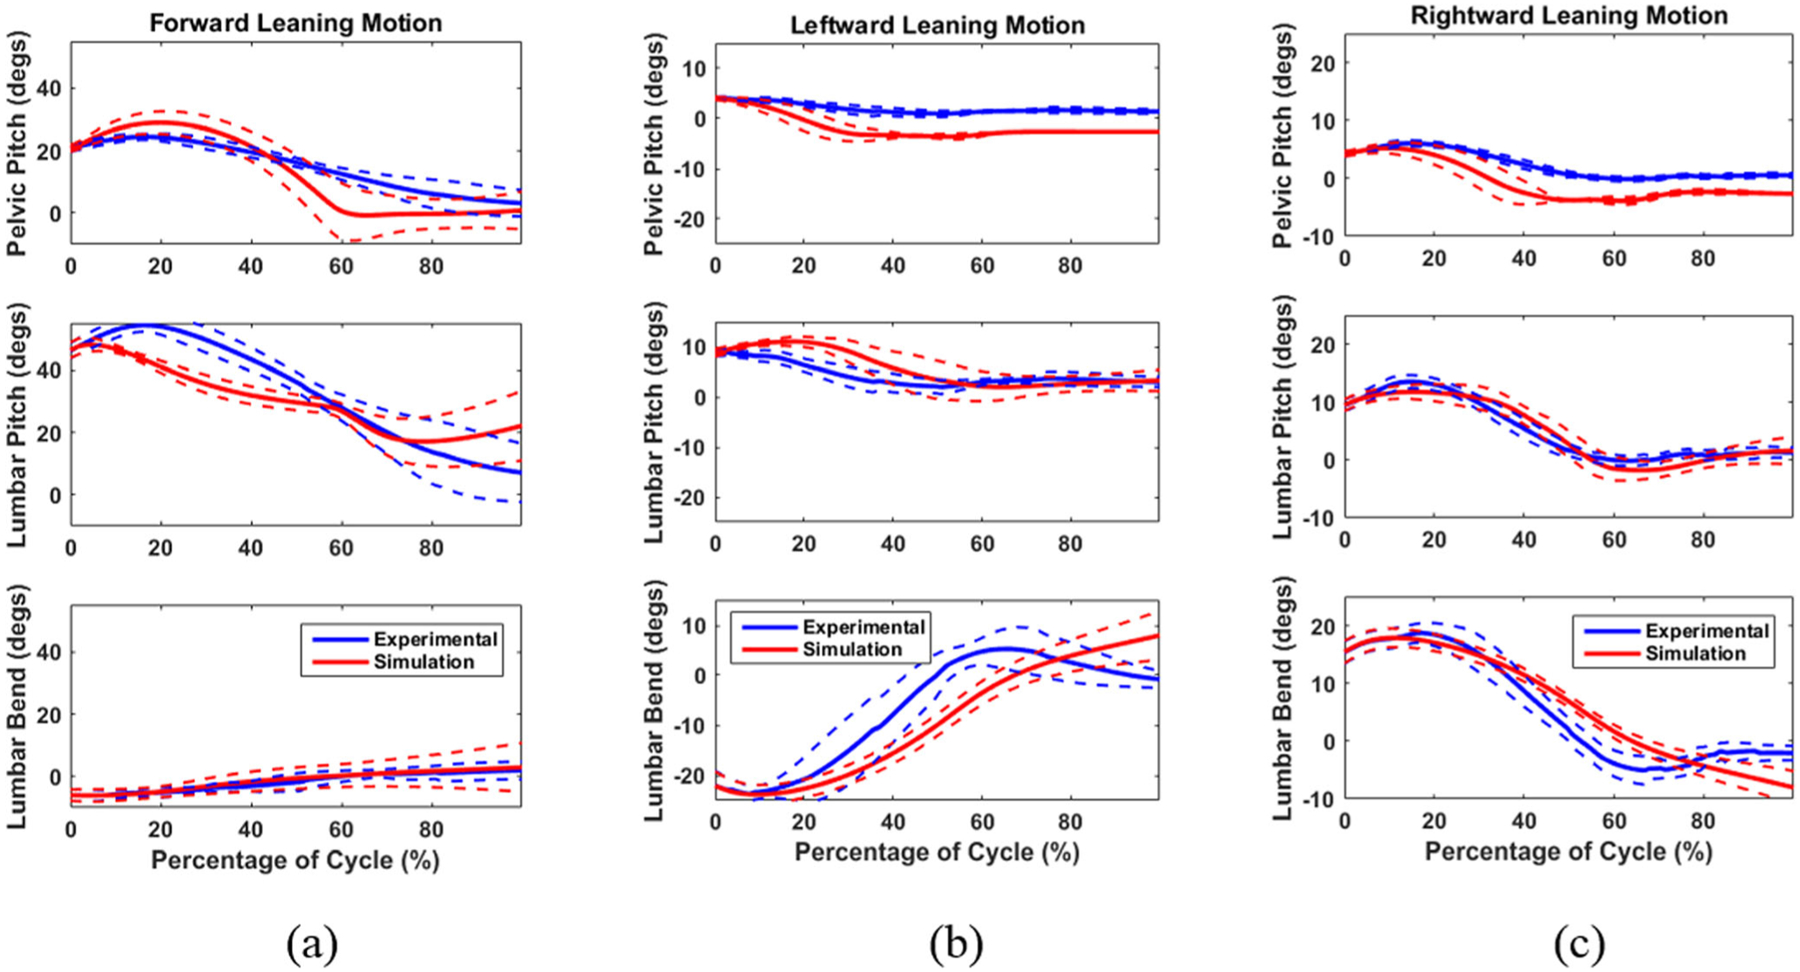
Plots of the joint angle outputs from S-2 in all three directions of lean: a Forward flexion in the sagittal plane (N = 14), and b leftward lateral bending (N = 13) and c rightward lateral bending (N = 10) in the coronal plane. The three joint angles are pelvic pitch, lumbar pitch, and lumbar bend. The blue lines are the means of the joint angle from the experimental trials and the red lines are the results from the simulation. The dashed lines are 1 standard deviation from the means