Figure 1.

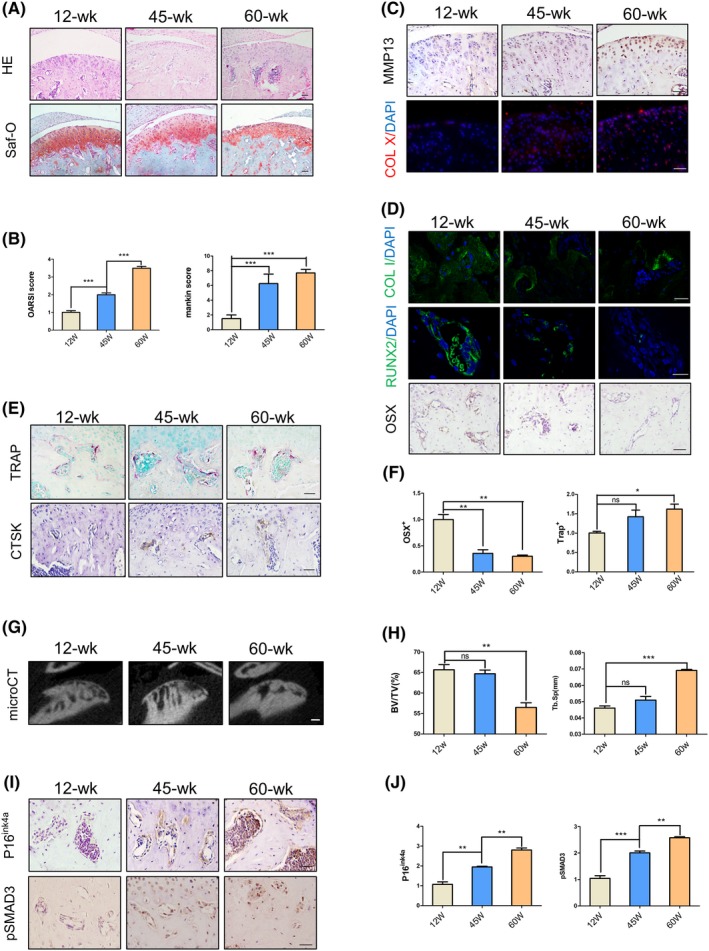
A degeneration phenotype was exhibited in temporomandibular condylar with ageing. A, HE and Safranin‐O staining images showing condylar cartilage layer of 12 wks, 45 wks or 60 wks. B, OA score (including OARSI and Mankin score) at different time points of mice condyle. C, Immunohistochemical and immunofluorescence analyses of metallomatrix protease 13 (MMP13) and collagen X (Col X) in the cartilage layer. D,E, Immunohistochemical and immunofluorescence (Osterix, Runx2, collagen I and cathepsin K) and tartrate‐resistant acid phosphatase (TRAP) staining in subchondral bone. F, Quantitative analysis of Osx+ and TRAP+ cell numbers. G,H, Representative μCT images and quantitative analysis. BV/TV (%), bone volume fraction; Tb.Sp (mm), trabecular separation. I,J, Immunohistochemical images showing expression of P16ink4a and pSMAD3 positive cells and quantitative analysis in subchondral bone. Scale bars, 50 μm. N = 5 per group. *P < .05, ***P < .005. Bars depict the mean ± SD and analysed by one‐way ANOVA followed by Tukey's test
