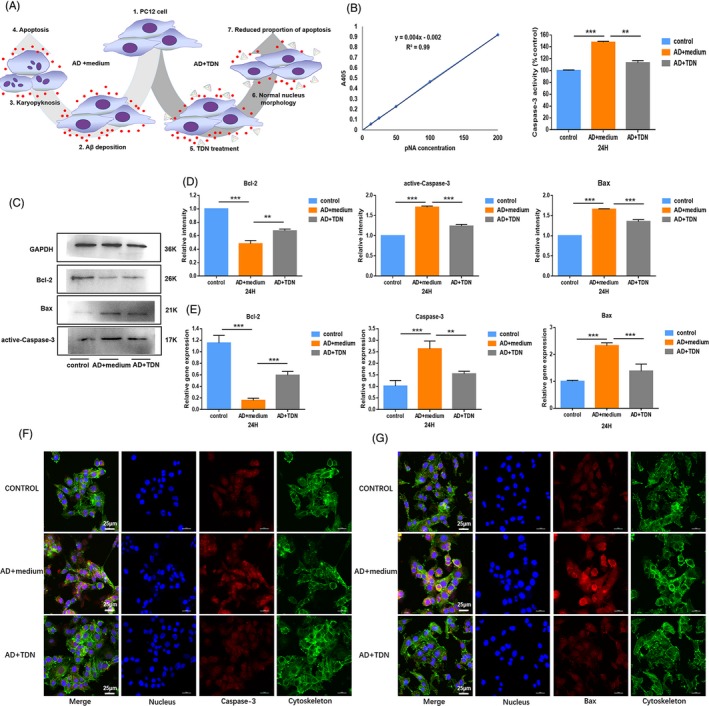
Figure 2.

Detection of apoptosis‐related proteins and genes. A, A schematic diagram showing the treatment effect of TDNs in an Alzheimer's disease cell model. 1, 2, 3 and 4 represent the process of establishing Alzheimer's disease cell models. 1, 5, 6 and 7 represent the process of TDNs treated Alzheimer's disease cell models. B, Changes in caspase‐3 activity detected by caspase‐3 Activity Assay Kit. C, Western blot analysis of protein expression levels upon exposure to TDNs (250 nmol/L) for 24 h. D, Quantification of protein expression levels upon exposure to TDNs (250 nM) for 24 h. Data are presented as mean ± SD (n = 4). Student's t test: **P < .01, ***P < .001. E, Quantification of gene expression levels upon exposure to TDNs (250 nmol/L) for 24 h. Data are presented as mean ± standard deviation (SD; n = 4). Student's t test: **P < .01, ***P < .001. F, Photomicrographs showing treated Alzheimer's disease cell model (Cytoskeleton: green, Nucleus: blue, Caspase‐3: red). Scale bars are 25 µm. G, Photomicrographs showing treated Alzheimer's disease cell model (Cytoskeleton: green, Nucleus: blue, Bax: red). Scale bars are 25 µm
