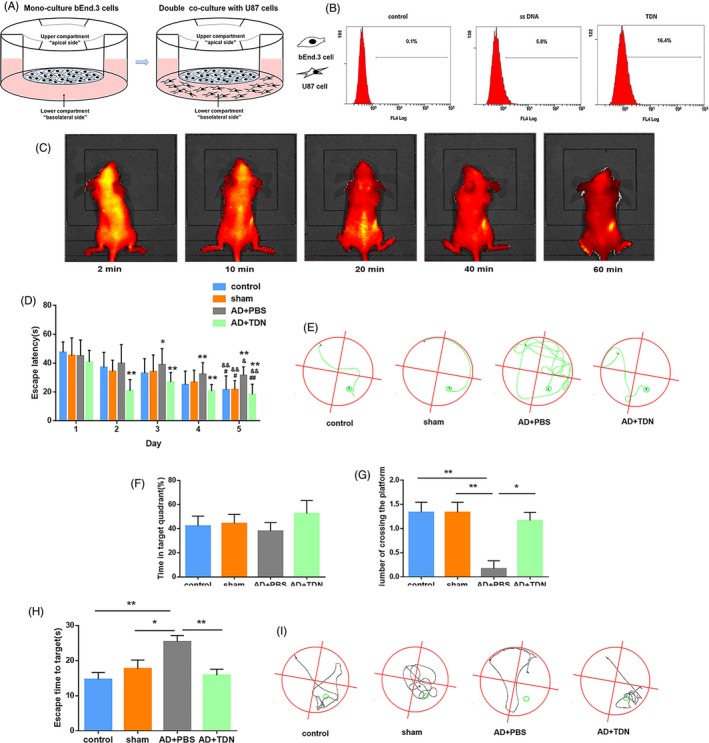
Figure 3.

Behavioural test results. A, Schematic diagram of the BBB pattern in vitro. B, Flow cytometry results. C, Detection of the in vivo distribution of TDNs in rats after tail‐vein injection by small animal in vivo imaging. D, Escape latency in the positioning navigation experiment for each group. *P < .05, **P < .01 vs control; # P < .05, ## P < .01 vs Alzheimer's disease + PBS Day 5; & P < .05, && P < .01 Day 5 vs Day 1. E, Trajectory map of rats after entering the water from the second quadrant during the positioning navigation test on the 5th day. F, Percentage of total time spent in the target quadrant during the space exploration experiment in each group. Data are presented as mean ± standard deviation (SD; n = 6). Student's t test was used for statistical analysis. G, The number of times the rats crossed the platform in each group in the space exploration experiment. Data are presented as mean ± SD (n = 6). Student's t test: *P < .05, **P < .01. H, Escape time to target. Data are presented as mean ± SD (n = 6). Student's t test: *P < .05, **P < .01. I, Trajectory map of rats in the space exploration experiment
