
Figure 5.
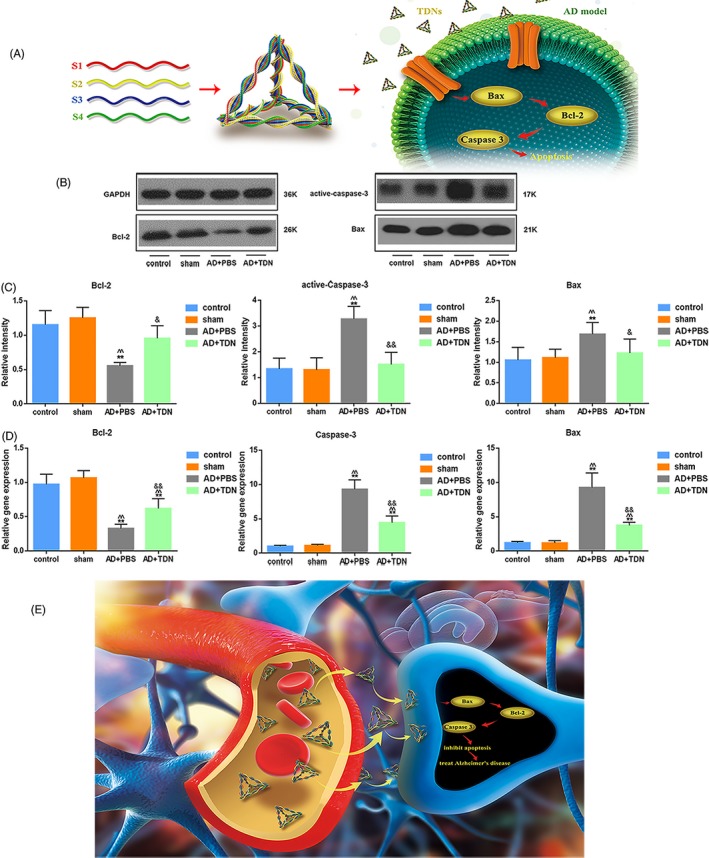
Examination of apoptosis‐related signalling pathway after tetrahedral DNA nanostructures (TDN) treatment. A, Schematic diagram of the effect of TDN on apoptotic signalling pathway in Alzheimer's disease model. B, Western blot analysis of the protein expression levels of active caspase‐3, Bcl‐2 and Bax in the hippocampus for each group. C, Quantification of protein expression levels in the hippocampus. Data are presented as mean ± SD (n = 6). Student's t test: *P < .05, **P < .01 vs control; ^ P < .05, ^^ P < .01 vs sham; & P < .05, && P < .01 vs Alzheimer's disease + PBS. D, Quantification of gene expression in the hippocampus. Data are presented as mean ± SD (n = 6). Student's t test: *P < .05, **P < .01 vs control; ^ P < .05, ^^ P < .01 vs sham; & P < .05, && P < .01 vs Alzheimer's disease + PBS. E, Schematic diagram of the therapeutic effect of TDN on Alzheimer's disease model