FIGURE 2.

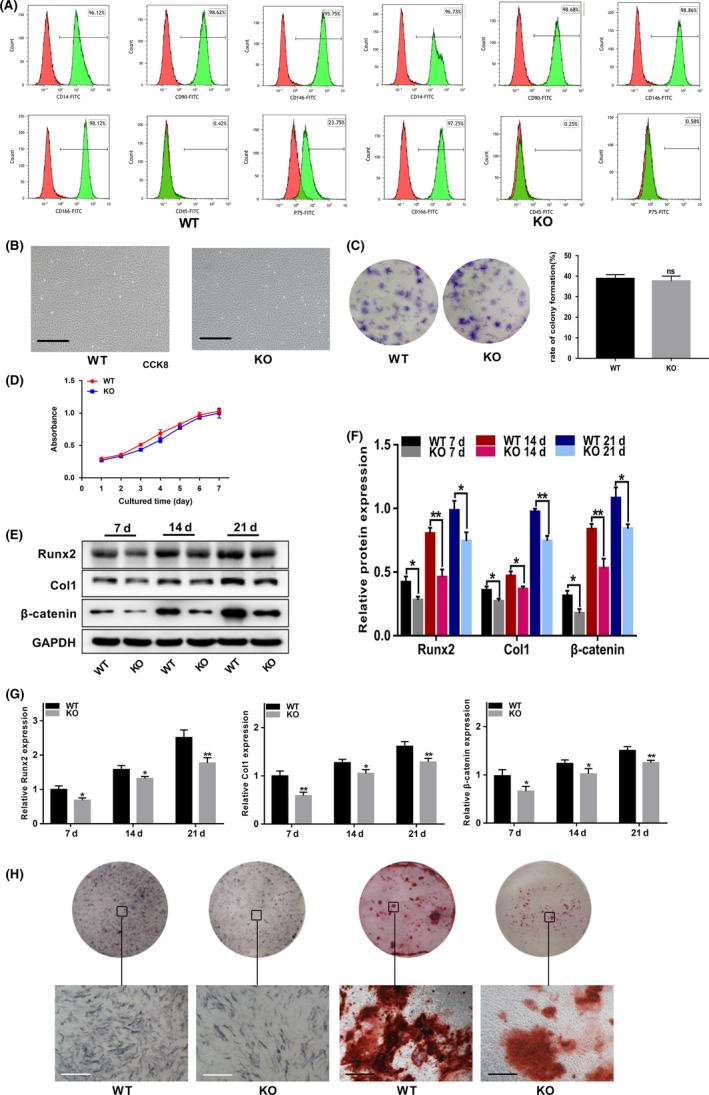
P75NTR−/− EMSCs exhibit decreased osteogenic differentiation capacity compared to WT EMSCs. (A) The p75NTR and mesenchymal stem cell surface markers (CD14, CD90, CD146 and CD166) and hematopoietic markers (CD45) were detected on WT and p75NTR−/− EMSCs by the Flow cytometry. (B) The third passage (P3) cells of E12.5d WT and p75NTR−/− EMSCs. Scale bar represents 50 μm. (C) Representative images of colonies formed by E12.5d WT and p75NTR−/− EMSCs and the analysis of colony formation. (D) The proliferation ratio of E12.5d WT and p75NTR−/− EMSCs was assessed by CCK‐8. WT and p75NTR−/− EMSCs were induced with osteogenic induction medium. On days 7, 14 and 21, the (E) protein levels of Runx2, Col1 and β‐catenin were detected by Western blot and (F) grayscale analysis was performed and the levels of the indicated proteins are expressed relative to the levels of GAPDH. (G) mRNA levels of Runx2, Col1 and β‐catenin were detected by real‐time PCR, respectively, using GAPDH as control. (H) On day 7, ALP staining was used to detect their potential of differential mineralization. On day 21, Alizarin Red staining was used to detect their mineralized nodules. Scale bar represents 50 μm. KO represent p75NTR−/−. Data are shown as mean ± SD from three independent experiments. *P < .05, **P < .01
