
Figure 3.
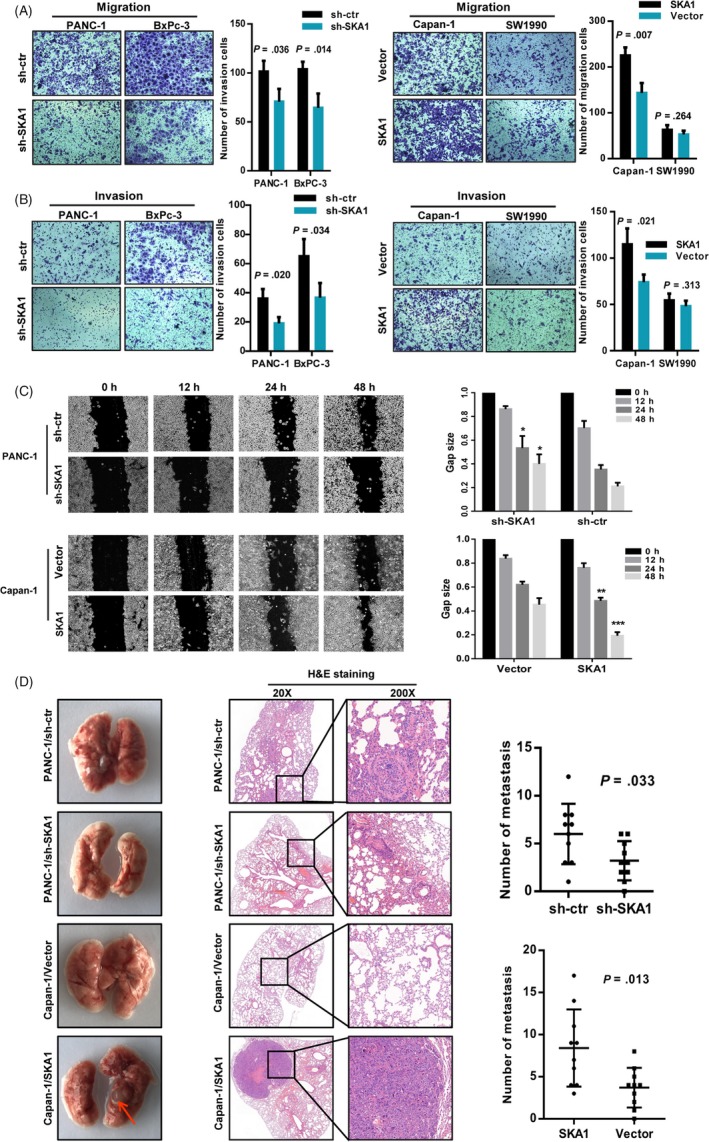
SKA1 accelerates tumour invasion and metastasis via EMT. A and B, Transwell migration and Matrigel invasion assay. sh‐SKA1 infectants exhibited significantly reduced migration and invasion capacity than the sh‐ctr infectants, except for SW1990 cell line. C, Wound‐healing assay measured the effect of SKA1 on PDAC cell motility. Left: Representative images of scratched and recovering of wounded areas taken at different time points. Right: Semi‐quantitative analysis of gap size by ImageJ. The significances were calculated based on the comparison of the control group. *P < .05; **P < .01; ***P < .001. D, Representative haematoxylin‐eosin staining and summarized data on number of metastasis of lung in nude mice at 12 wk after tail vein injection of PANC‐1 or Capan‐1 cells with SKA1 knock‐down or overexpression (n = 10 per group), red arrow, metastatic nodule (P = .033, P = .013, respectively)