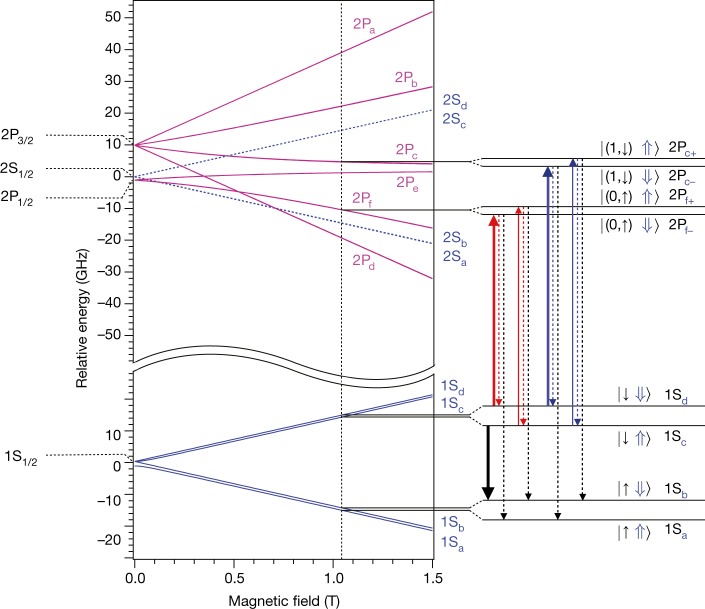
Fig. 1. Expected antihydrogen energy levels.
Calculated energies of the fine structure and the hyperfine sublevels of the 1S1/2, 2S1/2, 2P3/2 and 2P1/2 states are shown as functions of magnetic-field strength. The spin orientations for antihydrogen are shown; they are reversed for hydrogen. The centroid energy difference, E1S–2S = 2.4661 × 10¹⁵ Hz, has been suppressed on the vertical axis. Details of the energy levels relevant to this work at a magnetic field of B = 1.0329 T are shown on the right. Each state is labelled using conventional notation. For the 1S and 2S states, the hyperfine states are labelled with subscripts a–d in order of increasing energy (see, for example, ref. 7); namely, , , and , where the ket notation represents the positron spin (left; ↓ or ↑) and antiproton spin (right; ⇓ or ⇑) states in the high-field limit. The labels Sab and Scd are used when the antiproton spins are unpolarized. For the 2P states, the fine-structure splittings are labelled with subscripts a–f in order of decreasing energy at low magnetic fields, whereas the hyperfine splitting due to the antiproton spin is specified by subscripts + and − for spin parallel (⇑) and anti-parallel (⇓) to the magnetic field in the high-field limit, respectively. The symbol (↓,↑) in the figure indicates that the positron spin states are mixed for the 2Pc and 2Pf states. The vertical solid arrows indicate the one-photon laser transitions probed here: 1Sd → 2Pf− (bold red), 1Sc → 2Pf+ (thin red), 1Sd → 2Pc− (bold blue) and 1Sc → 2Pc+ (thin blue). The dashed red and blue arrows indicate relaxation to the same trappable level, which is not detectable in the present experiment, and the dashed black arrows indicate relaxation to untrappable levels, which is detectable via annihilation signals (see text). The bold black arrow shows the microwave transition used to eliminate 1Sc state atoms to prepare a doubly spin-polarized antihydrogen sample.

