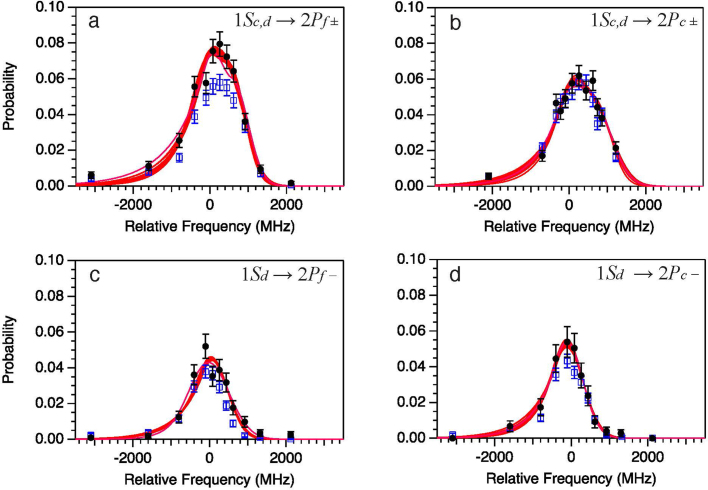
Extended Data Fig. 1. Determination of transition frequencies.
a–d, For each series, the experimental data (filled black circles with error bars) are plotted with fits of various models (red lines) discussed in Methods. The experimental data are normalized to the total number of the detected antihydrogen atoms and a laser power of 5 nW. Also shown are the results of standard simulations (open blue squares with error bars), similarly normalized to the total number of simulated atoms, illustrating the degree of agreement between the data and the simulations, without any tuning parameters. Some discrepancies in the amplitudes can be observed, which may point to errors in our laser power estimates. We note that because our frequency-fitting procedure allows variations in the relative amplitudes, the fits are largely insensitive to the amplitude differences (Methods). Error bars represent 1σ.

