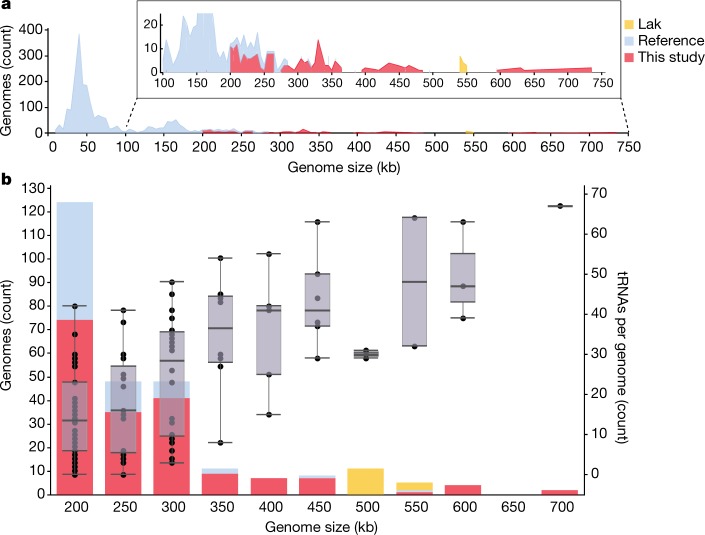
Fig. 1. Distribution of the genome sizes and tRNAs of phages.
a, Size distribution of circularized bacteriophage genomes from this study, Lak megaphage genomes reported recently for a subset of the same samples9 and reference sources. Reference genomes were collected from all complete RefSeq r92 dsDNA genomes and non-artefactual assemblies with lengths of more than 200 kb from a previous study14. b, Histogram of the genome size distribution of phages with genomes of more than 200 kb from this study, Lak and reference genomes. Box-and-whisker plot of tRNA counts per genome from this study and Lak phages as a function of genome size (Spearman’s ρ = 0.61, P = 4.5 × 10⁻²², n = 201 individual phage genomes). The middle line for each box marks the median tRNA count for each size bin, the box marks the interquartile range, and the whiskers represent the maximum and minimum.

