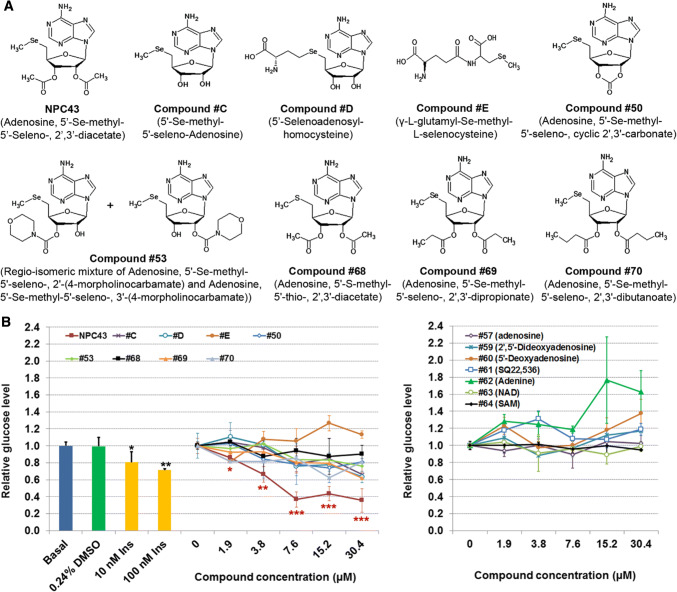
Fig. 1.
Identification of NPC43 as an inhibitor of glucose production in HepG2 cells. a Chemical structures of NPC43 and eight other related compounds. b Effects of NPC43 and other listed compounds on glucose production in HepG2 cells. Equal amounts of HepG2 cells were seeded on 96-well plates and cultured in 10% FBS DMEM media overnight. These cells were treated without (basal) or with 0.24% (v/v) DMSO (the maximum volume of tested compound solvent; zero concentration group), insulin or various concentrations of the above listed compounds (left panel) and other related compounds (right panel) from Sigma (Online Resource 2) in serum-free glucose production media for 48 h and then subjected to glucose production assay and cell viability analysis. Relative glucose levels were obtained by normalizing the glucose concentration in culture media by cell number in each sample. Data are presented as mean ± SD for four replicates per group. *P < 0.05, **P < 0.01, ***P < 0.001 vs. 0.24% DMSO group (Student’s t test)

