Fig. 2.
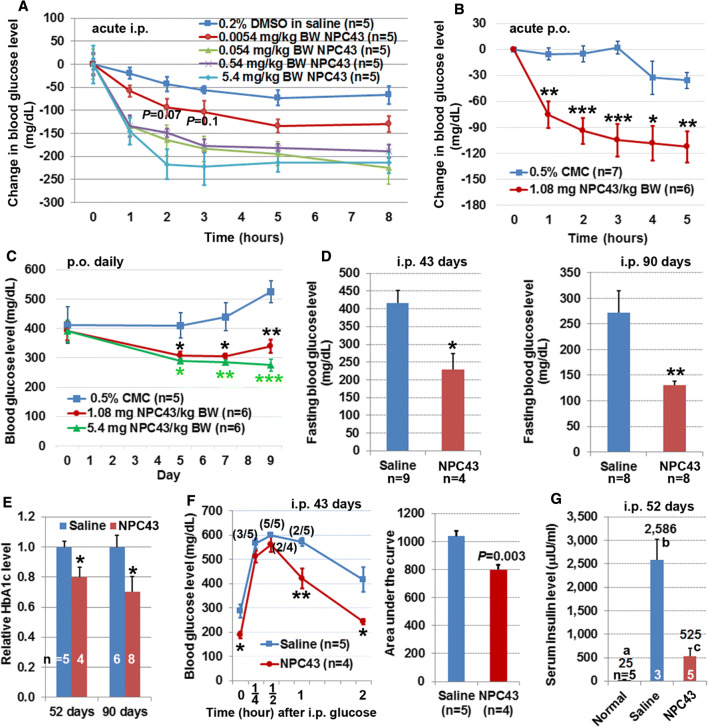
Anti-diabetic activity of NPC43 in Leprdb/db mice. a, b Decreased blood glucose levels in Leprdb/db mice after acute (a) i.p. and (b) p.o. treatment with NPC43. In a, 8- to 10-week-old Leprdb/db mice were fasted overnight and then i.p. injected with 0.2% (v/v) DMSO/physiological saline or indicated doses of NPC43. In b, adult Leprdb/db mice were fasted for 2 h and then p.o. administered with 0.5% (w/v) carboxymethylcellulose (CMC) or NPC43 (1.08 mg/kg BW). Blood glucose levels in Leprdb/db mice right before and after i.p. or p.o. treatment at indicated time points (under fasting conditions but having free access to water) were examined. The change in blood glucose level in each mouse was obtained by subtracting the glucose level right before i.p. injection or oral gavage (0 time point) from the blood glucose level at each time-period after i.p. injection or oral gavage. In a, with the exception of the P values shown (which relate to 2- and 3-h-time points of the 0.0054 mg/kg BW treatment), all other reductions were significant (P at least less than 0.05, Student’s t test) when compared with the corresponding time points for DMSO/saline injection. Mean ± SEM. In b, mean ± SEM, *P < 0.05, **P < 0.01, ***P < 0.001 vs. 0.5% CMC group at the same time point (Student’s t test). c Decreased blood glucose levels in Leprdb/db mice after chronic p.o. administration of NPC43. Male 65-day-old Leprdb/db mice were fasted for 2 h and then fed daily (by oral gavage) with 0.5% CMC or NPC43 for 5, 7 and 9 consecutive days. Blood glucose levels in 2 h-fasted Leprdb/db mice before (day 0) and after p.o. treatment (day 5, 7 and 9) were determined using a glucometer. Mean ± SEM. *P < 0.05, **P < 0.01, ***P < 0.001 vs. 0.5% CMC group at the same time point (Student’s t test). d, e Decreased blood (d) glucose and (e) HbA1c levels in Leprdb/db mice after chronic i.p. treatment with NPC43. Male Leprdb/db mice at 38 days of age were i.p. injected daily with 0.2% (v/v) DMSO/physiological saline (saline control) or NPC43 (0.136 mg/kg BW) for 43, 52 or 90 days. Blood or sera from overnight-fasted saline- or NPC43-treated mice were subjected to (d) blood glucose and (e) HbA1c analysis. Data shown in d and e were collected from two independent animal experiments. Mean ± SEM. *P < 0.05, **P < 0.01 vs. saline control group (Student’s t test). f Improved glucose tolerance in Leprdb/db mice after chronic i.p. treatment with NPC43. Male Leprdb/db mice at 41-days of age were i.p. injected daily with 0.2% (v/v) DMSO/physiological saline or NPC43 (0.136 mg/kg BW) for 43 days, fasted overnight and then subjected to intraperitoneal glucose tolerance tests. Blood glucose levels (left panel) at indicated time point before or after i.p glucose injection in these mice were determined and the areas under the curve (right panel) were calculated. Numbers in parentheses in the left panel refer to the ratio of animals with blood glucose levels ≥ 600 mg/dl. Mean ± SEM. *P < 0.05, **P < 0.01 vs. saline control group at the same time point (Student’s t test). g Decreased serum insulin levels in Leprdb/db mice after chronic i.p. treatment with NPC43. Male Leprdb/db mice at 38-days of age were i.p. injected daily with 0.2% (v/v) DMSO/physiological saline or NPC43 (0.136 mg/kg BW) for 52 days. Sera from overnight-fasted saline- and NPC43-treated Leprdb/db mice as well as age-matched wild-type C57 mice (without treatments, referred to normal group) were subjected to the insulin analysis. Numbers on the top of each column are the mean values of insulin levels. Mean ± SEM. Different letters represents a statistical significance between those two groups (Student’s t test)

