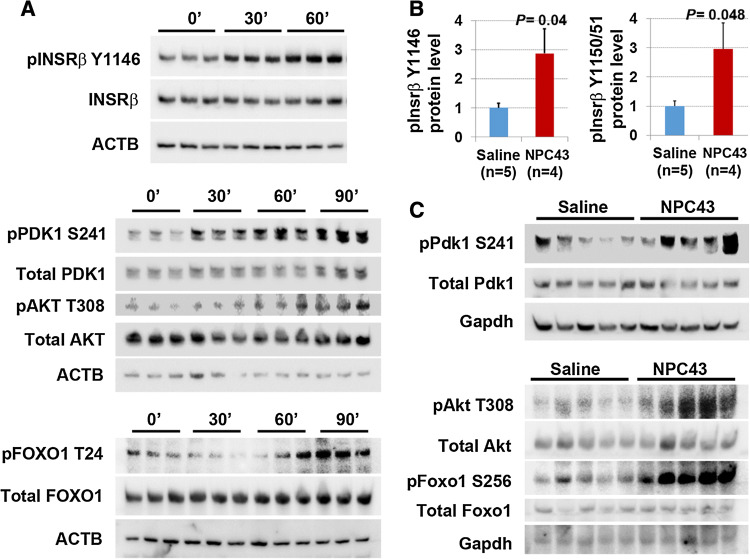
Fig. 4.
Insulin-independent activation of INSR signaling by NPC43 in both HepG2 cells and liver tissues of Leprdb/db mice. a Enhanced phosphorylation of INSR, PDK1, AKT and FOXO1 in HepG2 cells after NPC43 treatments. HepG2 cells were serum-starved overnight, incubated without (0 min) or with NPC43 (7.6 μM) for 30 min, 60 min or 90 min (triplicates/group) and then subjected to Western blot analysis (using 5 μg protein per sample). Quantitative data for protein expression of these molecules (shown in Western blots) are shown in Online Resource 5. b, c Enhanced phosphorylation of (b) Insrβ at Y1146 and Y1150/1151 and (c) Pdk1/Akt/Foxo1 in the livers of Leprdb/db mice after chronic i.p. treatment with NPC43. Five Leprdb/db mice at postnatal day 38 were i.p. injected with 0.2% (v/v) DMSO/saline (saline control) or NPC43 (0.136 mg/kg BW) daily for 52 days. Liver tissues from these saline- and NPC43-treated Leprdb/db mice were collected and then subjected to (b) ELISA analysis of phosphorylated Insrβ at Y1146 (using 400 μg protein/mouse) or at Y1150/1151 (using 600 μg protein/mouse) and (c) Western blot analysis of other listed molecules (using 100 μg protein/mouse). In b, data are presented as mean ± SEM of indicated numbers of animals and P values (vs. the saline group) were determined using the Student’s t test program. Quantitative data for protein expression of Pdk1/Akt/Foxo1 signaling molecules in c Western blots are shown in Online Resource 6

