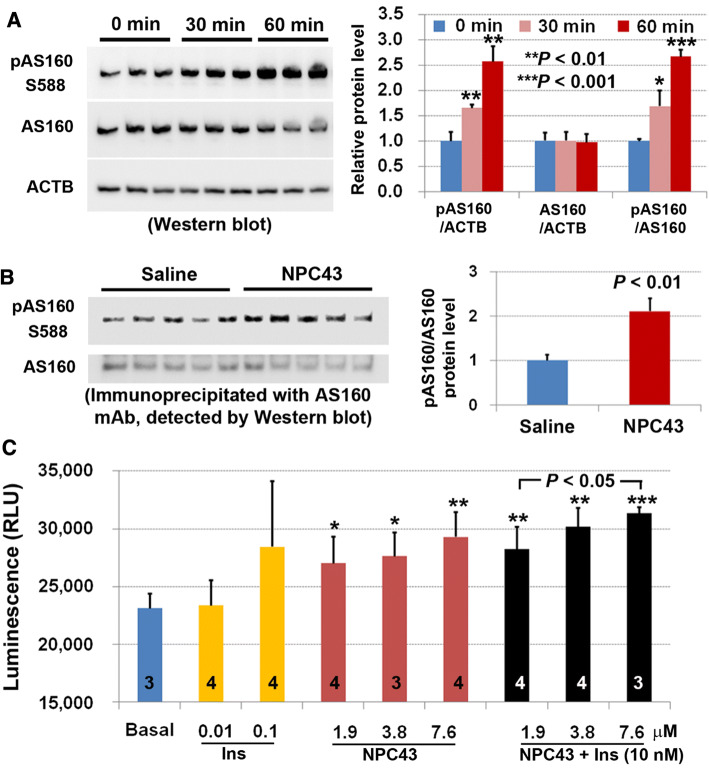
Fig. 5.
Enhanced AS160 phosphorylation in both human HepG2 cells and livers of Leprdb/db mice and stimulation of glucose uptake in mouse AML-12 cells by NPC43. a Western blot analysis showing the increased AS160 phosphorylation in HepG2 cells after treatment with NPC43 (7.6 μM) in serum-free media for 30 and 60 min. Five micrograms of HepG2 cell protein extracts (triplicates/group) were used in Western blot analysis, and quantitative expression levels of these proteins in Western blots (left panel) were determined using NIH Image J software and are shown in the right panel. Mean ± SD. *P < 0.05, **P < 0.01, ***P < 0.001 vs. the 0 min (before NPC43 treatment) control group (Student’s t test). b Enhanced AS160 phosphorylation in the livers of Leprdb/db mice after chronic treatment with NPC43 (0.136 mg/kg BW, i.p. daily for 52 days starting at postnatal day 38), as determined by immunoprecipitation followed by Western blot analysis. One milligram of liver protein extract from five individual mice after saline or NPC43 treatments was used in immunoprecipitation studies, and quantitative expression levels of these proteins in Western blots (left panel) were determined using NIH Image J software and are shown in the right panel. Mean ± SEM of five animals/group. P value vs. the saline group (Student’s t test). c Insulin-like activity of NPC43 in the stimulation of glucose uptake in AML-12 cells. AML-12 cells (1.5 × 10⁵/96-well) were cultured overnight, serum-starved overnight and then treated without (basal) or with insulin, NPC43 or both insulin (10 nM) and NPC43 in glucose- and phenol red-free DMEM media at 37 °C for 1.5 h followed by incubation with 1 mM 2-deoxyglucose (2DG) at room temperature for 30 min. Luminescence of up-taken glucose (i.e., 2DG) was determined using a luminometer. Data are presented as mean ± SD of the indicated number (shown inside the column in the bar graph) of replicates per group. *P < 0.05, **P < 0.01, ***P < 0.001 vs. the basal group (Student’s t test)

