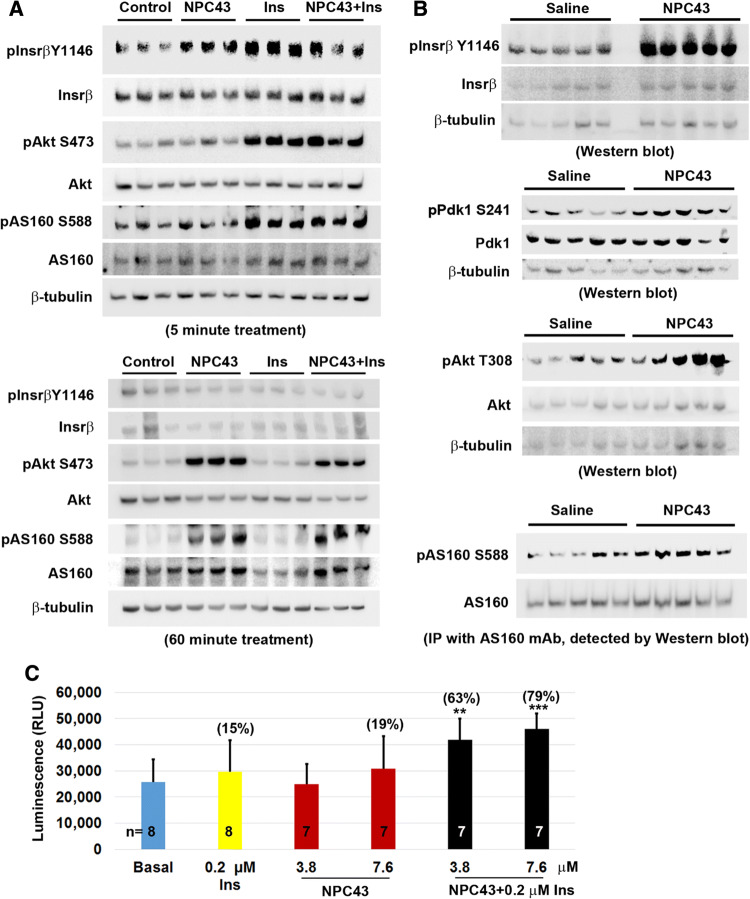
Fig. 6.
Activation of Insr/Akt/AS160 signaling in both differentiated mouse C2C12 cells and skeletal muscle of Leprdb/db mice by NPC43 and cooperative action of NPC43 and insulin in the stimulation of glucose uptake in differentiated C2C12 cells. a Activation of Insr and stimulation of Akt and AS160 phosphorylation in differentiated mouse C2C12 (skeletal muscle) cells by NPC43. Completely differentiated C2C12 cells were serum-starved overnight, treated without (Control) or with NPC43 (7.6 μM), insulin (0.2 μM) or both in serum-free DMEM media at 37 °C for 5 (top panel) or 60 (bottom panel) minutes and then subjected to Western blot analysis (using 8 μg protein, triplicates/group). Quantitative data of the expression levels of these proteins detected in Western blots are shown in Online Resource 7. b Activation of Insr and stimulation of Akt and AS160 phosphorylation in the skeletal muscle of Leprdb/db mice by NPC43. Five Leprdb/db mice at postnatal day 38 were i.p. injected with 0.2% (v/v) DMSO/saline or NPC43 (0.136 mg/kg BW) daily for 52 days. Gastrocnemius from these mice was collected and subjected to Western blot analysis (using 100 μg protein/mouse) of pInsrβ Y1146 (activated Insr), pPdk1 S241 and pAkt T308 or immunoprecipitation (IP, using 400 μg protein/mouse) with a specific AS160 monoclonal antibody followed by Western blot analysis of pAS160 S588. Quantitative data for protein expression of the above Insr signaling molecules are shown in Online Resource 9. c Effects of insulin and NPC43 on glucose uptake in differentiated mouse C2C12 cells. C2C12 cells (5000 cells/96-well) were cultured in 10% FBS/DMEM media for 5 days and then differentiated using 0.5% horse serum/DMEM media for 7 days. These differentiated C2C12 cells were pretreated without or with NPC43 (3.8 or 7.6 μM) in serum- and glucose-free DMEM media overnight and then treated without (basal) or with insulin (0.2 μM), NPC43 (3.8 and 7.6 μM) or both insulin and NPC43 in serum- and glucose-free DMEM media at 37 °C for 1.5 h followed by incubation with 1 mM 2DG at room temperature for 30 min. Luminescence of up-taken glucose (i.e., 2DG) was determined using a luminometer. Data are presented as mean ± SD of indicated number of replicates per group. **P < 0.01, ***P < 0.001, vs. the basal group (Student’s t test). Percentage in parentheses in the bar graph refers to the mean percentage of increased glucose uptake in that group when compared to the basal group

