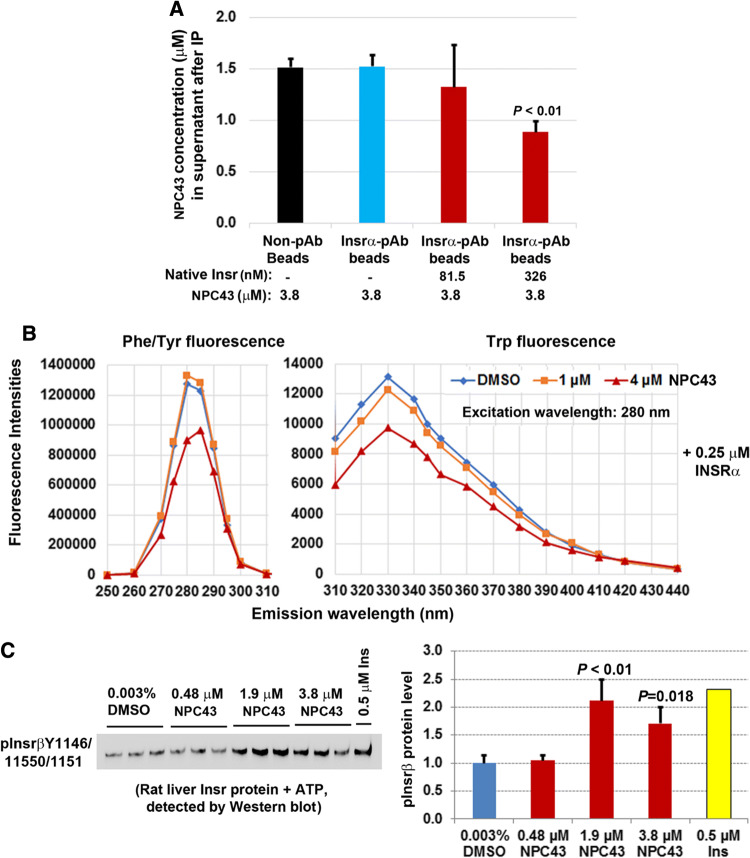
Fig. 7.
NPC43 interacted with the extracellular domain of INSR protein (INSRα) and directly activated rat liver Insr protein in a cell-free, in vitro phosphorylation system. a Cell-free in vitro binding of NPC43 to rat liver Insrα protein. NPC43 (3.8 μM) was incubated with or without native rat liver Insr proteins (containing Insrα and β) followed by incubation with non-antibody (Non-pAb)- or Insrα antibody (Insrα pAb)-conjugated magnetic beads [immunoprecipitation (IP)] to remove Insrα-bound NPC43 (by Insrα/Insrα-pAb-beads) or non-specific-bound NPC43 [by Non-pAb- or Insrα pAb-conjugated beads only (first and second column)]. The concentrations of remaining NPC43 in the supernatants after IP were determined by liquid chromatography coupled to time-of-flight mass spectrometry. Mean ± SD of triplicates per group. P value vs. the first and second columns in the bar graph (Student’s t test). b A representative fluorescent study showing a decrease in Phe/Tyr and Trp fluorescence in INSRα proteins after incubation with NPC43 (4 μM). NPC43 (1 or 4 μM) or its solvent DMSO (0.006%, v/v) in PBS buffer was incubated with 0.25 μM recombinant INSRα protein (aa 1–956) at room temperature for 10 min and then subjected to fluorescence analysis to obtain the fluorescence spectra of samples at the emission wavelengths from 250 to 440 nm with an excitation wavelength of 280 nm. Experiments were repeated three times. c Cell-free in vitro phosphorylation assays showing the direct activation of rat liver Insr proteins by NPC43. Equal amounts of purified rat liver Insr protein (final concentration: 0.13 μM) were incubated with 0.003% DMSO (triplicates), insulin (0.5 μM, singlet) or NPC43 (0.48, 1.9 or 3.8 μM, triplicates/group) in the presence of ATP, and the activated Insr (i.e. phosphorylated-Insrβ at Y1146, 1150 and 1151) was detected by Western blot analysis using both pInsrβY1146 and pInsrβY1150/1151 antibodies. Expression levels of activated Insr detected in the Western blot (left panel) were determined using NIH ImageJ software and are shown in the right panel. In the bar graph, data are presented as Mean ± SD of triplicates per group (except the insulin group) and P values were determined by performing Student’s t test (vs. the 0.003% DMSO group)

