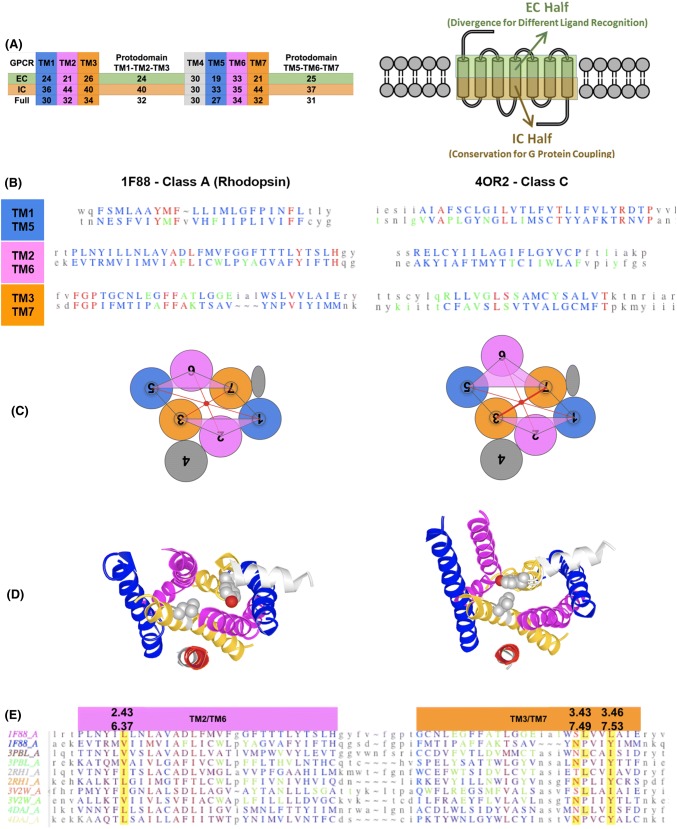
Fig. 6.
Deconstruction of GPCR Domains. a Right panel: Definition of TMH halves facing the Extracellular (EC) and Intracellular (IC) sides. Left Panel: Sequence similarity score (see Methods section for details) of the aligned EC half, IC half, and Full TM sequences for each of the 7 TMs for a diverse set of GPCRs spanning all classes and subclasses. Protodomain 1 and 2 scores are also given (averages over 3TMH). Colors correspond to TMHs vertically and EC and IC halves horizontally. EC halves show a lower score for each TMH compared to IC halves in GPCRs (see text). b Pairwise Protodomain alignment (RMSD: 1F88 = 3.24 Å; 4OR2 = 3.31 Å). The symmetrically conserved pattern, especially in TM3/TM7 surrounding the ligand, in each domain is idiosyncratically conserved (Red = conserved, Green indicates ligand binding/proximity residues (in less than 4 Å distance) (see text). c–d Rhodopsin inactive vs. active conformational change seen from the IC side (binding G-protein not shown for clarity). Left inactive (PDB: 1GZM), right active (pdbid 6CMO). The optimum alignment as shown is obtained from VAST + (Madej et al. 2014) [see Figure S12 for details). The iCn3Dvisualization (using the “alternate” command—keyboard shortcut “a”) gives a good grasp of the conformational change (see text). e Multiple alignment of protodomains of a number of Class A GPCRs showing symmetry-related residue pairs (highlighted in yellow) also involved in key contacts (in green) [See text for details]

