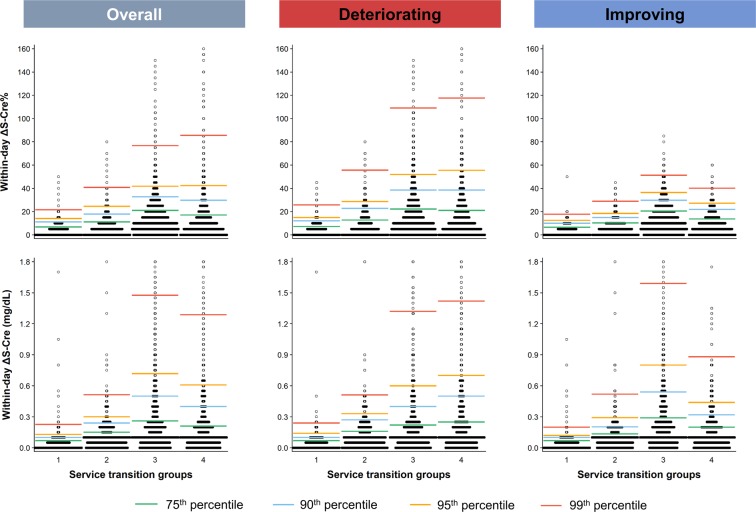
Figure 1.
Box-percentile plot of the difference and percent change in S-Cre levels within 24 hours (within-day ΔS-Cre and ΔS-Cre%) in overall population and in patients with deteriorating or improving kidney function based on patients’ service transition patterns (Four groups: Group 1, OPT-to-OPT; Group 2, OPT-to-ED or INPT; Group 3, ED-to-ED or INPT; and Group 4, INPT–to-INPT). Specific percentiles are highlighted by color lines: median, green; 75th percentile, blue; 90th percentile, yellow; and 95th percentile, red. ED, emergency department; INPT, inpatient; OPT, outpatient; S-Cre, serum creatinine.

