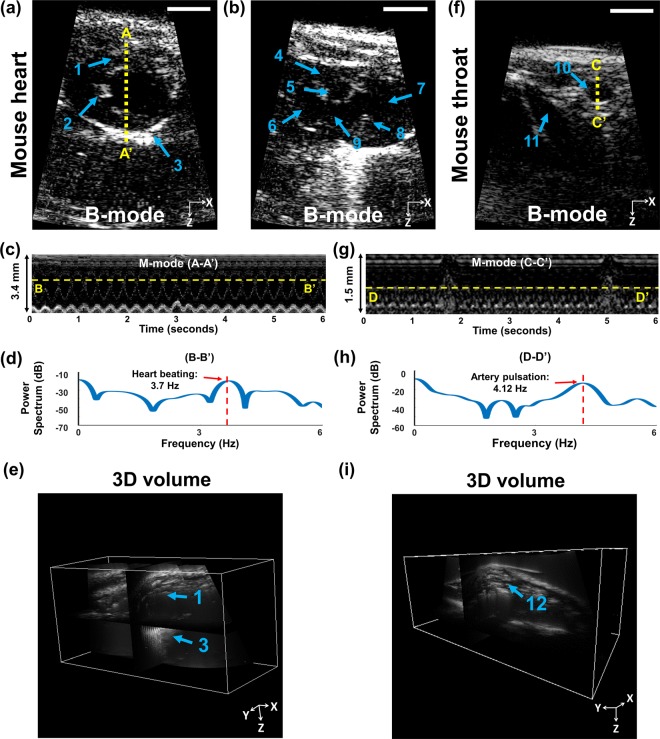
Figure 3.
In vivo ultrasound imaging of a mouse with the MEMS-US-TT (tabletop) system. (a,b) B-mode images of the mouse heart from two different angles. (c) M-mode image of the line A-A’. (d) Power spectrum of the line B-B’. (e) 3D volume image of the mouse heart. (f) B-mode image of the mouse throat. (g) M-mode image of the line C-C’. (h) Power spectrum of the line D-D’. (i) 3D volume image of the mouse throat. All scale bars are 3 mm. 1, left ventricle (LV) anterior wall; 2, LV papillary muscle; 3, LV posterior wall; 4, left atrium; 5, aortic valve; 6, pulmonary artery; 7, right atrium; 8, pulmonary valve; 9, right ventricular outflow tract; 10, aortic arch; 11, jugular vein; 12, carotid artery.

