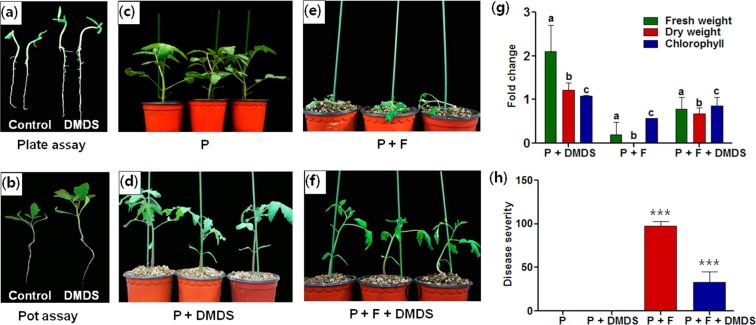
Figure 2.
Effect of volatile dimethyl disulfide (DMDS) on the growth of tomato in the plate and pot assay. (a) Control and DMDS-treated plants in the plate assay, (b) plants in the pot assay, (c) non-treated plant, (d) plants treated with DMDS, (e) plants infected with Sclerotinia minor, (f) S. minor infected plants under DMDS treatment, (g) fold change in fresh, dry and chlorophyll content depending on the experimental conditions, (h) disease severity. P, plant; F, fungi. Results are the mean values for five replicates. Small letters above the error bars represent significant differences according to Bonferroni’s multiple comparison test (p value = 0.05). Asterisks indicate significant changes in the values calculated by Student’s t-test (***p < 0.001).

