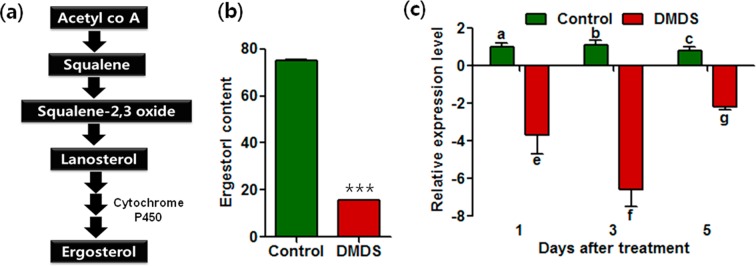
Figure 6.
Analysis of ergosterol biosynthesis in dimethyl disulfide (DMDS)-treated and non-treated fungi. (a) Biosynthetic pathway of ergosterol, (b) ergosterol content in the control and DMDS-treated fungi, and (c) relative expression of CYP51 at different time intervals. Error bars indicate standard deviation. Small letters above the error bars represent significant differences according to the Bonferroni’s multiple comparison test (p value = 0.05). Asterisk indicates a significant change in the values calculated by Student’s t-test (***p < 0.001).

