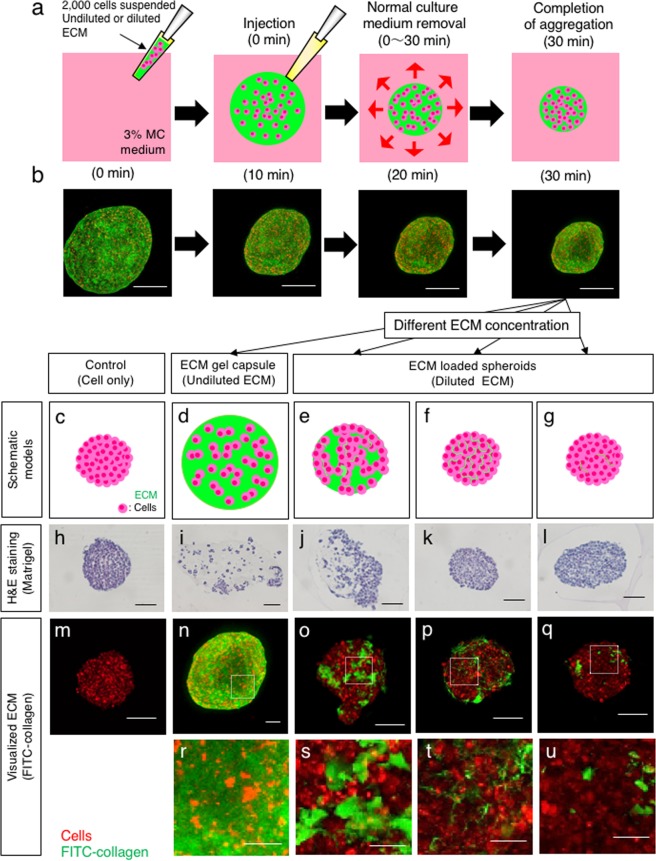
Figure 1.
Co-aggregation of cells and macromolecules with high and low concentrations in MC medium. (a) Schematic overview of aggregation with macromolecules such as ECM components and polysaccharides in MC medium. (b) Injected suspension mixture of PKH26-stained Hep G2 cells (red) with FITC-collagen (green) at the indicated time points after injection. Bar = 200 µm. (c–g) Schematic overview of 3D tissues composed of cells and different concentrations of ECM. (h–l) Haematoxylin and eosin staining of 3D tissues loaded with the indicated concentrations of Matrigel. Bar = 100 µm. (m–q) ECM in the spheroids was visualized by using different dilutions of FITC-collagen (green) together with Hep G2 cells (red) as in (b). Bar = 100 µm. (r–u) are the insets in (n–q) surrounded by dashed line rectangles. Bar = 20 µm.

