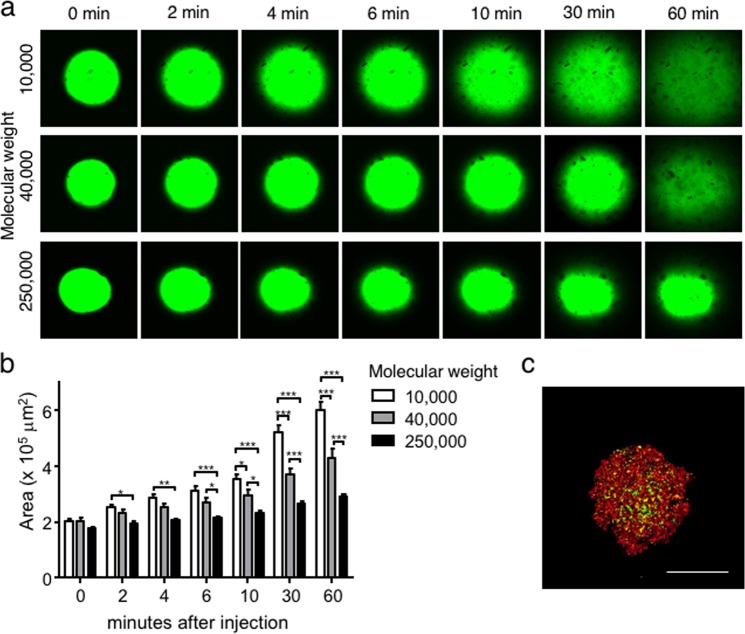
Figure 3.
Aggregation with different molecular weights of polysaccharides in MC medium. (a) Three different molecular weights of FITC-dextran with average sizes of 10,000, 40,000 and 250,000 were injected into MC medium. The time-dependent dextran distribution was observed (a), and fluorescent areas were quantified (b). Bar = 200 µm. The data are the means ± SEMs, n = 3. *p < 0.05, **p < 0.01, ***p < 0.001 by two-way ANOVA vs. the 10,000 group at each time point. (c) Hep G2 cells labelled with PKH26 (red) and molecular weight of 250 FITC-dextran (green) were mixed and injected into MC medium. After one day of culture, aggregation was observed. Bar = 200 µm.

