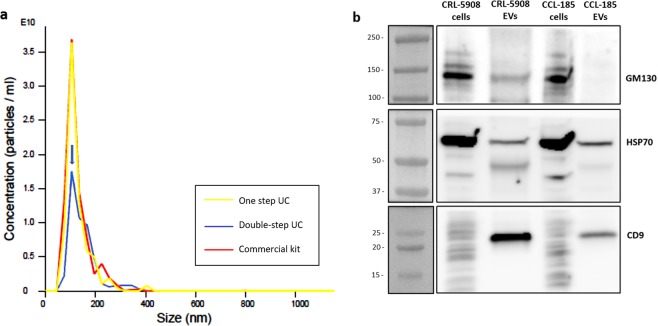
Figure 1.
(a) Nanoparticle Tracking analysis (NTA) of EVs derived from CRL-5908 cells isolated with three different methods: Yellow line indicates EVs isolated with one-step ultracentrifuge method, red line EVs isolated with commercial kit, and blue line EVs isolated with double-step ultracentrifuge method (peak indicated by arrow). EVs have a mean diameter of 133.7 +/− 6.5 nm and mode of 107.5 +/− 1.7 nm. EV-concentration is expressed as numbers of particles per mL, y axis is marked from 1 to 3,5 E10. (b) Western-blot image of CRL-5908 and CCL-185 cells lysates and their respective isolated EVs: EVs lysates showed higher expression of CD9, lower but presence of HSP70, and absence of GM130 in comparison with cell lines lysates.

