Figure 2.
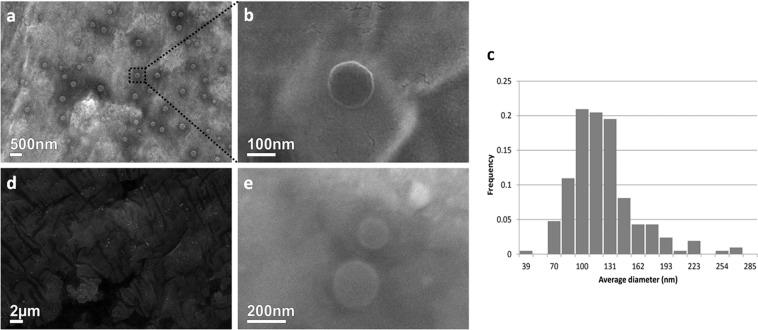
Scanning electron microscopy analysis. (a) EVs isolated through double ultracentrifugation. (b) Magnification of a single EV after double ultracentrifugation. (c) Histogram showing the diameter of EVs (nm) separated in its frequency with a peak on 100 to 140 nm. (d) Results of single ultracentrifugation at electron microscopy levels, observing protein or salt aggregates but no EVs, in comparison to double-step ultracentrifugation. (e) Electron microscopy analysis of EVs isolated with ExoEasy Kit revealed similar results as double-step ultracentrifugation.

