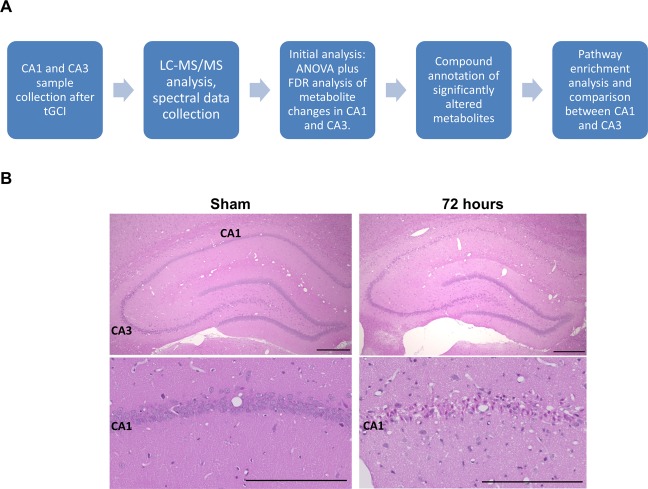
Figure 1.
(A) Experimental workflow from collection of samples to pathway enrichment analysis. (B) H&E staining of rat sections [Upper row: lower magnification, Bar = 500 µm, lower row: higher magnification, Bar = 250 µm], Sham and 72 hours, showing the loss of neurons in the CA1 sub-region of the hippocampus after 72 hours of tGCI as compared to the intact Sham operated rats. In the higher magnification images, small pyknotic neurons are observed indicating neuronal apoptosis.

