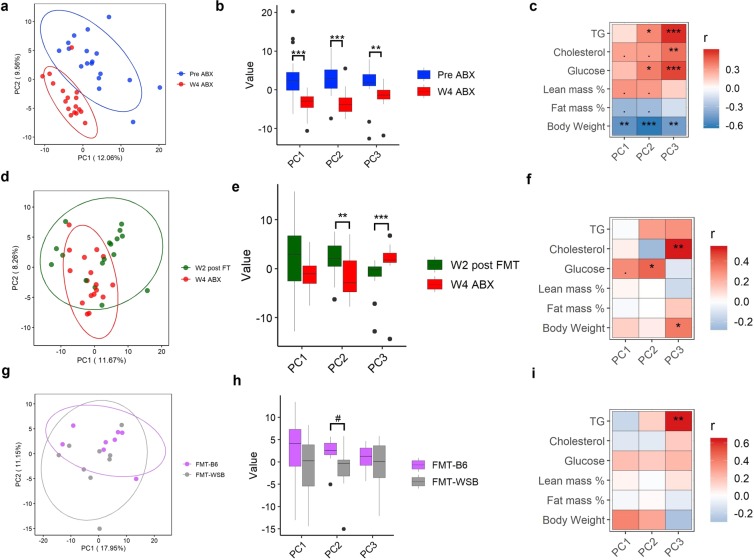
Figure 4.
Principal component analysis plot of plasma metabolites. (a) Scores are shown for the two first PCs from the PCA of data on plasma metabolites at baseline and after depletion of gut microbiota by 4-wk antibiotics treatment. Each point represents a sample at baseline (blue) or after 4 wk ABX (red). The ellipse on the principal coordinate analysis plot indicates 95% CI of the clusters by study time points. (b) Comparison of the contribution of baseline and gut microbiota depleted samples on the PC1, PC2, and PC3. (c) Correlation between corresponding PC1, PC2, and PC3 and plasma clinical parameters. (d) Scores are shown for the two first PCs from the PCA of data on plasma metabolites after depletion of gut microbiota by 4-wk antibiotics treatment and 2 wk post-FMT. Each point represents a sample after 4 wk ABX (red) or at 2 wk post-FMT (green). The ellipse on the principal coordinate analysis plot indicates 95% CI of the clusters by study time points. (e) Comparison of the contribution of baseline and gut microbiota depleted samples on the PC1, PC2, and PC3. (f) Correlation between corresponding PC1, PC2, and PC3 and plasma clinical parameters. (g) Scores are shown for the two first PCs from the PCA of data on plasma metabolites at 2 wk post fecal microbial transplantation. Each point represents a mouse that received FMT from either a WSB/EiJ (pink) or a C57BL/6J (gray) mouse donor. The ellipse on the principal coordinate analysis plot indicates 95% CI of the clusters by FMT groups. (h) Comparison of the corresponding PC1, PC2, and PC3 between samples collected from FMT groups after at 2 wk fecal transplantation. (i) Correlation between corresponding PC1, PC2, and PC3 and plasma clinical parameters at 2 wk post-FMT. “***”P < 0.001, “**”P < 0.01, “*”P < 0.05, “.”P < 0.10.

