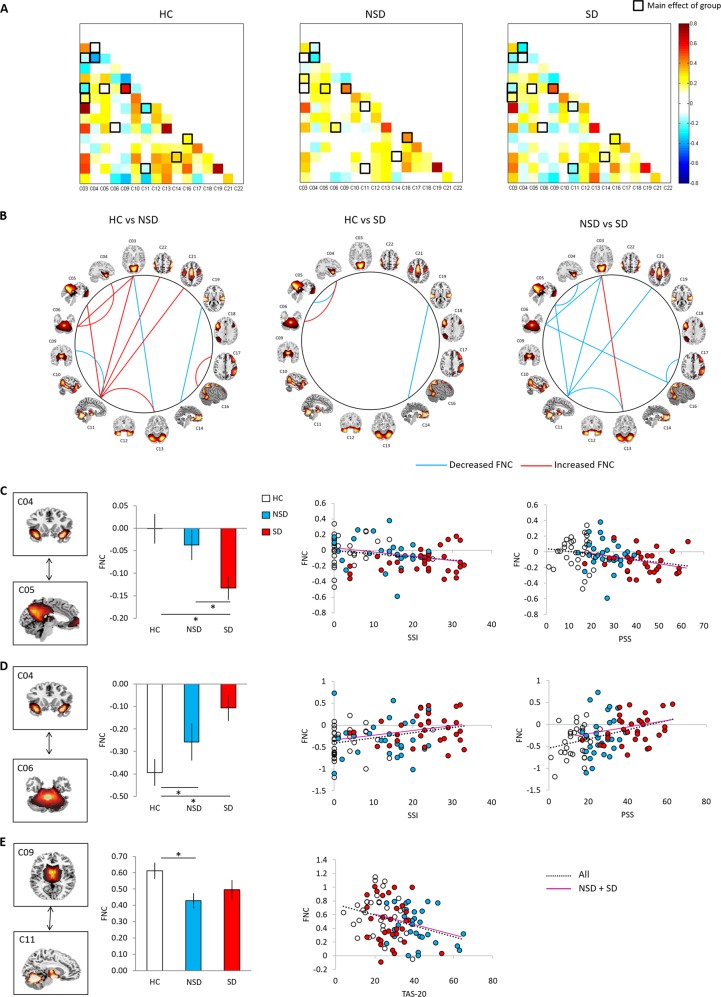
Fig. 3.
Functional network connectivity (FNC) between RSNs. a FNC matrix. Pairwise correlations between RSN time courses were Fisher z-transformed and averaged across subjects within the HC, NSD, and SD groups. The black boxes indicate FNC that showed a significant group effect. b Group differences in the selected FNC. The blue line indicates a decreased FNC and the red line indicates an increased FNC (p < 0.05). c The relationship between the FNC and behavioral measures. The FNC between C04 (IN) and C05 (DMN). d The FNC between C04 (IN) and C06 (CN). e The FNC between C09 (BGN) and C11 (TCN). White bars and circles represent the HC, blue ones represent the NSD, and red ones represent the SD. Error bars indicate the standard error. Dotted lines indicate the correlation of all participants and pink lines patients. *p < 0.05

