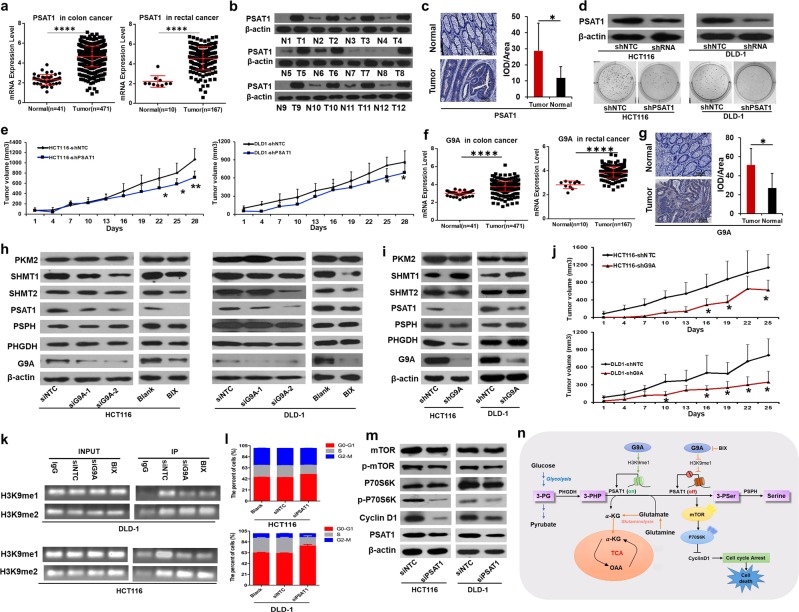
Fig. 1.
PSAT1 was regulated by G9A and enhanced cell proliferation in colorectal cancer. a Relative expression of PSAT1 in normal and tumor tissues from colon cancer and rectal cancer samples from the TCGA database (FC (PSAT1 in colon cancer) = 2.02; FC (PSAT1 in rectal cancer) = 2.06; ****p < 0.0001; cancer versus normal). b PSAT1 expression between CRC tissue specimens and the corresponding normal specimens was examined by western blot assay (n = 12 pairs; N normal, T tumor). c Representative immunohistochemical images and semiquantitative analysis of PSAT1 protein between CRC tissue specimens and the corresponding normal tissues in the tissue chip (immunohistochemical staining, scale bar = 100 µm, n = 30 pairs, *p < 0.05). d Colony formation assay of HCT116 and DLD-1 cells (stably expressing PSAT1 shRNA) in soft agar for 14 days. e Xenograft tumor volumes were determined in nude mice after generation of tumors using HCT116 and DLD-1 cells stably expressing NTC or PSAT1 shRNA. (n = 5, *p < 0.05, **p < 0.01). f Relative expression of G9A in the normal and cancer samples of CRC from the TCGA database. The fold changes (FCs) of G9A expression in colon and rectal cancer were 1.26 and 1.37, respectively (****p < 0.0001; cancer versus normal). g Representative immunohistochemical images and semiquantitative analysis of G9A protein between CRC tissue specimens and the corresponding normal specimens in the tissue chip immunohistochemical staining; scale bar = 100 µm; n = 30 pairs; *p < 0.05). h, i After depletion of G9A, the protein expression of G9A and related metabolic enzymes in HCT116 and DLD-1 cells was investigated by western blot assay. j Xenograft tumor volumes were determined in nude mice after generation of tumors using HCT116 and DLD-1 cells stably expressing NTC or G9A shRNA (n = 5, *p < 0.05). k NTC or G9A siRNA was transfected into DLD-1 and HCT116 cells or BIX (BIX01294, 5 μM) was added to DLD-1 and HCT116 cells for 48 h. H3K9me1 and H3K9me2 levels in the PSAT1 promoter were analyzed by ChIP assay. l Cell cycle analyses were carried out in HCT116 and DLD-1 cells expressing NTC or PSAT1 siRNA by flow cytometry. m The protein expression levels of total mTOR, p-mTOR, total P70S6K, p-P70S6K, and cyclin D1 were examined by western blot in HCT116 and DLD-1 cells expressing NTC or PSAT1 siRNA. n A model of the possible mechanism underlying PSAT1 regulation of cancer development in CRC

