Fig. 1.
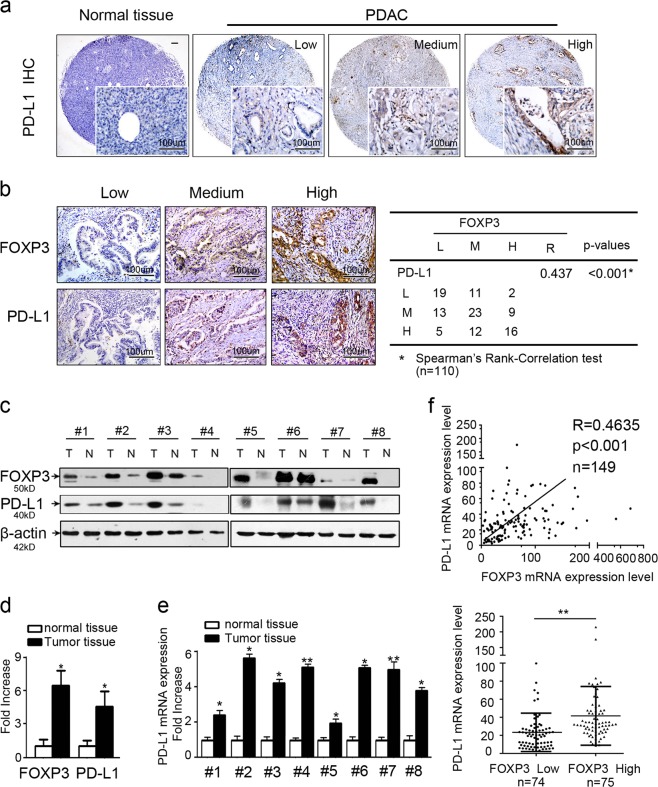
PD-L1 correlates with C-FOXP3 expression in human pancreatic ductal adenocarcinoma (PDAC). a Representative samples of PD-L1 staining in normal pancreatic tissues and PDAC tissues (brown) by immunohistochemistry. Magnification: ×40 and ×200. b (Left) PD-L1 and FOXP3 expression in PDAC tissues by immunohistochemistry (magnification: ×200). (Right) Statistical analysis of immunohistochemical results of PD-L1 and FOXP3 expression in 110 human PDAC samples. R (correlation coefficient) and p values were calculated by Spearman’s rank-correlation test. c Western blot analysis of PD-L1 and FOXP3 levels in eight total paired human PDAC tumors and matched adjacent normal tissues. PD-L1 and FOXP3 protein expression levels were normalized to those of β-actin (N: normal; T: tumor). d PD-L1 and FOXP3 protein expression levels in PDAC specimens versus paired adjacent normal tissues. Histogram (columns: mean, bars: standard deviation, n = 8). p values were calculated by Student’s t-test, *p < 0.05. e PD-L1 mRNA expression levels in PDAC specimens versus paired adjacent normal pancreatic tissues by RT-PCR analysis. Histogram (columns: mean, bars: standard deviation, n = 3). p values were calculated by Student’s t-test, *p < 0.05, **p < 0.01. f (Upper) Correlation between PD-L1 and FOXP3 mRNA expression in samples from 149 patients with PDAC from The Cancer Genome Atlas (TCGA). Spearman’s rank-order correlation test was applied to measure the strength of the association between PD-L1 and FOXP3 mRNA levels (R = 0.4635, p < 0.001). (Lower) PD-L1 expression in patients with FOXP3-low tumors (n = 74) and FOXP3-high tumors (n = 75); p values were calculated by the Mann–Whitney test, **p < 0.01

