Fig. 3.
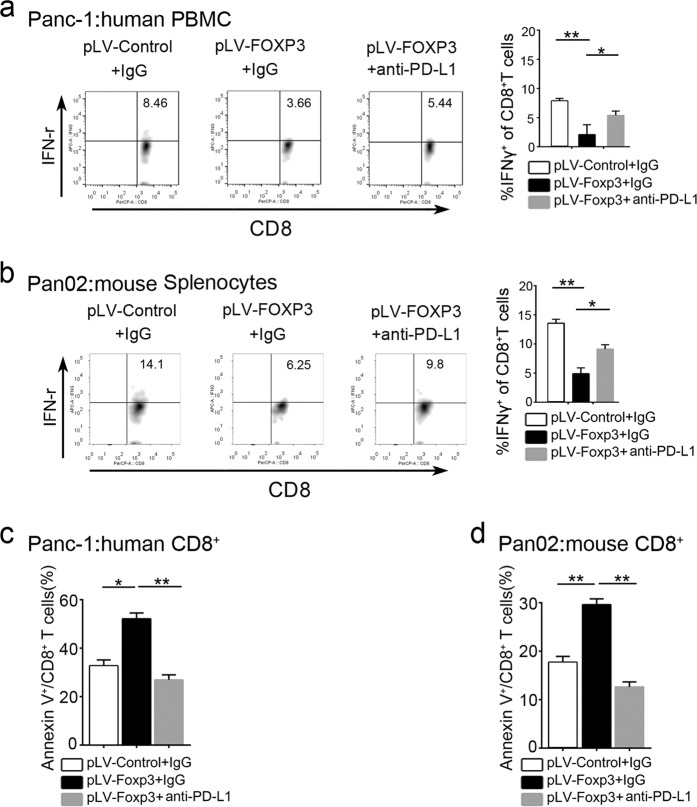
Functional measure of C-FOXP3-induced upregulation of tumoral PD-L1. a Human peripheral blood mononuclear cells (PBMCs) were isolated from healthy volunteer peripheral blood and stimulated with IL-2, anti-CD3 and anti-CD28 mAbs for 48 h. Then, PBMCs were cocultured with Panc-1-pLV-control or Panc-1-pLV-FOXP3 (pLV-control and pLV-FOXP3 indicate lentivirus vectors for control and overexpression of C-FOXP3) in the absence or presence of anti-PD-L1 for 18 h. The expression of IFNγ+ on CD8+ T cells was determined by flow cytometry. b Mouse splenocytes were isolated from the spleens of C57BL/6 mice and stimulated with IL-2, anti-CD3 and anti-CD28 mAbs for 48 h. Then, splenocytes were cocultured with Pan02-pLV-control or Pan02-pLV-FOXP3 in the absence or presence of anti-PD-L1 for 18 h. The expression of IFNγ+ on CD8+ T cells was determined by flow cytometry. c Human CD8+ T cells were isolated from healthy volunteer peripheral blood and stimulated with IL-2, anti-CD3, and anti-CD28 mAbs for 48 h. Then, CD8+ T cells were cocultured with Panc-1-pLV-control or Panc-1-pLV-FOXP3 in the absence or presence of anti-PD-L1 for 18 h. The expression of Annexin V+ CD8+ T cells was determined by flow cytometry. d Mouse CD8+ T cells were isolated from the spleens of C57BL/6 mice bearing Pan02-pLV-control tumors and stimulated with IL-2, anti-CD3 and anti-CD28 mAbs for 48 h. Then, CD8+ T cells were cocultured with Pan02-pLV-control or Pan02-pLV-FOXP3 in the absence or presence of anti-PD-L1 for 18 h. The expression of Annexin V+ CD8+ T cells was determined by flow cytometry. Histogram (columns: mean, bars: standard deviation, n = 3), p values were calculated by Student’s t-test, *p < 0.05, **p < 0.01

