Fig. 5.
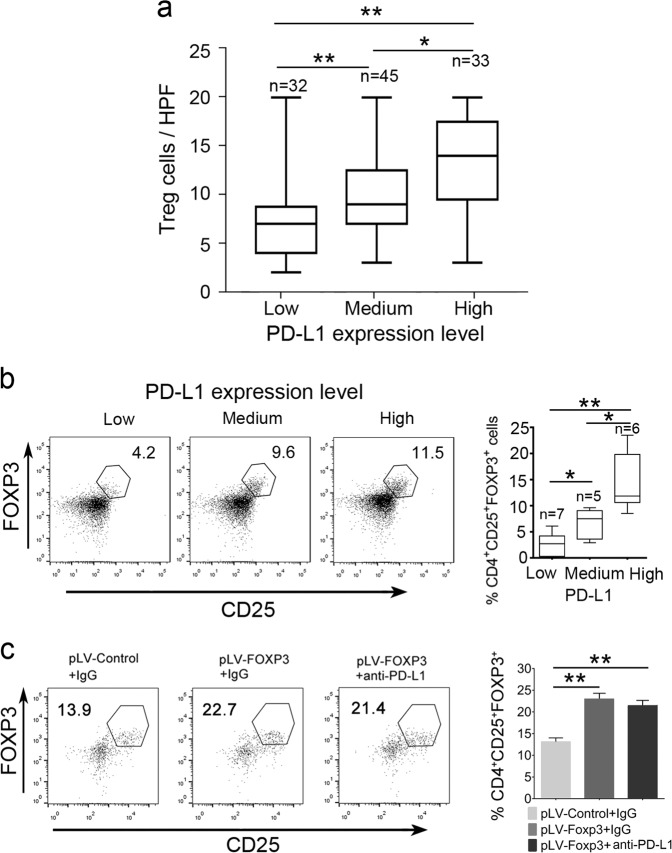
PD-L1 expression is correlated with the accumulation of FOXP3+ Treg cells in PDAC. a Statistical analysis of FOXP3+ Treg cell accumulation in the PDAC microenvironment with low, medium and high expression of PD-L1 (n = 110). Box plot presentation (the median horizontal line represents the median value, and the upper and lower lines represent the 25th and 75th percentiles, respectively), *p < 0.05, **p < 0.01 by the Mann–Whitney test. b (Left) Flow cytometry analysis (FACS) of FOXP3+ Treg cell accumulation in tumor tissues from fresh surgical samples (n = 18). (Right) Summary data are shown as box plot presentation (the median horizontal line represents the median value, and the upper and lower lines represent the 25th and 75th percentiles, respectively), *p < 0.05, **p < 0.01 by the Mann–Whitney test. c Treatment of PDAC xenografts with anti-PD-L1 antibody. (Left) Tregs were counted by FACS. pLV-control and pLV-FOXP3 indicate lentivirus vectors for the control and overexpression of C-FOXP3. (Right) Histogram (columns: mean, bars: standard deviation, n = 5), *p < 0.05, **p < 0.01. p values were calculated by one-way ANOVA tests

