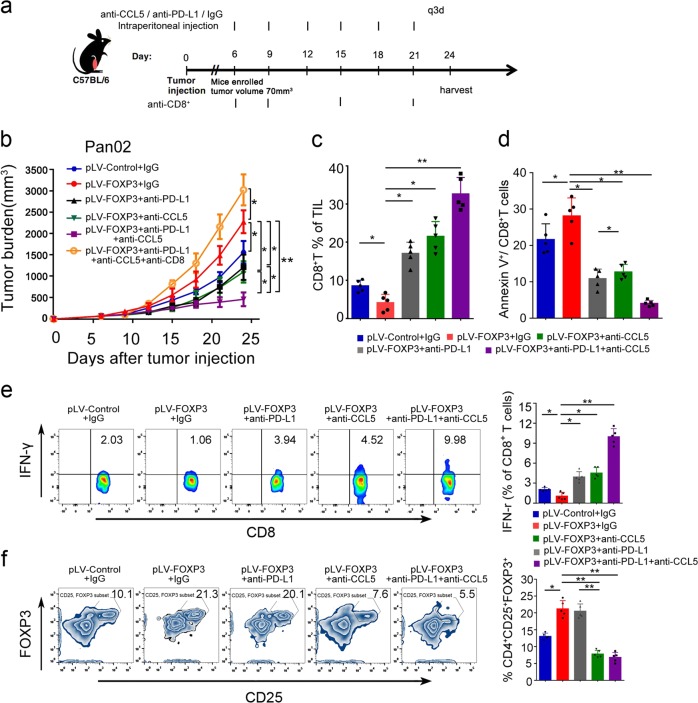
Fig. 6.
Anti-PD-L1 antibody enhances the antitumor effect of CCL5 blockade in PDAC in mice with high C-FOXP3 levels. a C57BL/6 mice were inoculated subcutaneously with Pan02-pLV-control or Pan02-pLV-FOXP3 murine pancreatic tumor cells in their right thoracic flanks. When tumors reached approximately 70 mm3, mice were treated with 200 μg (intraperitoneal injection q3d) of isotype control. pLV-control and pLV-FOXP3 indicate lentivirus vectors for control and overexpression of C-FOXP3. b Tumor growth was evaluated by measuring tumor volumes and compared statistically by one-way ANOVA with the Bonferroni post hoc test. Line chart, points: mean, bars: standard deviation. n = 5, *p < 0.05, **p < 0.01. c, d Flow cytometry analysis of CD8+ T cell percentages of total tumor infiltrating lymphocytes (TILs) in the tumor microenvironment between the control IgG and anti-CD8 injection groups. Summary data of flow cytometry analysis of apoptotic CD8+ T cells in the tumor microenvironment between different groups are shown as histograms (columns: mean; bars: standard deviation, n = 5, p values were calculated by one-way ANOVA with Bonferroni post hoc test, *p < 0.05, **p < 0.01. e (Left) Quantification of IFNγ-producing CD8+ T cells as percentages of total cells. IFNγ-producing CD8+ T cells were evaluated by FACS. (right) Histogram (columns: mean; bars: standard deviation, n = 5). p values were calculated by one-way ANOVA with Bonferroni post hoc test. *p < 0.05, **p < 0.01. f (Left) FACS analysis of Treg recruitment into the tumor microenvironment. (Right) Histogram (columns: mean; bars: standard deviation, n = 5). p values were calculated by one-way ANOVA with Bonferroni post hoc test. *p < 0.05, **p < 0.01

