
Figure 1.
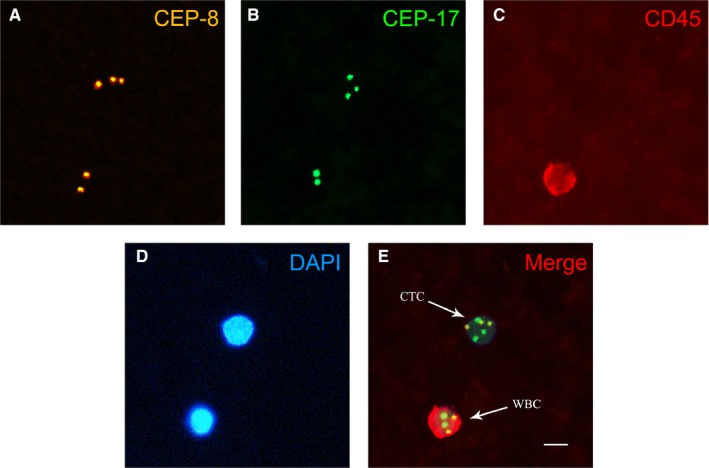
Detected circulating tumor cells (CTCs) in the peripheral blood of gastric cancer patients. A, CEP‐8 probe signal staining (yellow) in CTCs (three points) and white blood cells (WBCs) (two points). B, CEP‐17 probe signal staining (green) in CTCs (three points) and WBCs (two points). C, CD45 staining (red) in CTCs (negative) and WBCs (positive). D, DAPI staining (blue) in CTCs and WBCs. E, Merged image with probe signals and CD45 and nuclear staining; CTCs were identified as polyploid CEP8+/CD45−/DAPI+ or polyploid CEP17+/CD45−/DAPI+ cells, and WBCs were identified as diploid CEP8+/CD45+/DAPI+ or diploid CEP17+/CD45+/DAPI+ cells. Scale bar = 10 µm