Figure 3.

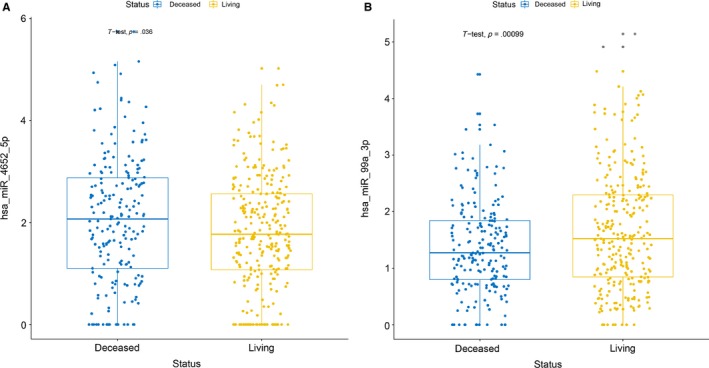
The Student's T‐test of the two DEMs expression value between Living and Deceased group. The results were statistical difference (A:miR‐4652‐5p: P = .036; B:miR‐99a‐3p: P = .00099)

The Student's T‐test of the two DEMs expression value between Living and Deceased group. The results were statistical difference (A:miR‐4652‐5p: P = .036; B:miR‐99a‐3p: P = .00099)